

Where are LA’s COVID-19 hot spots?


How big is the latest COVID-19 surge? Last month, new cases in Los Angeles County increased by 714% over June.
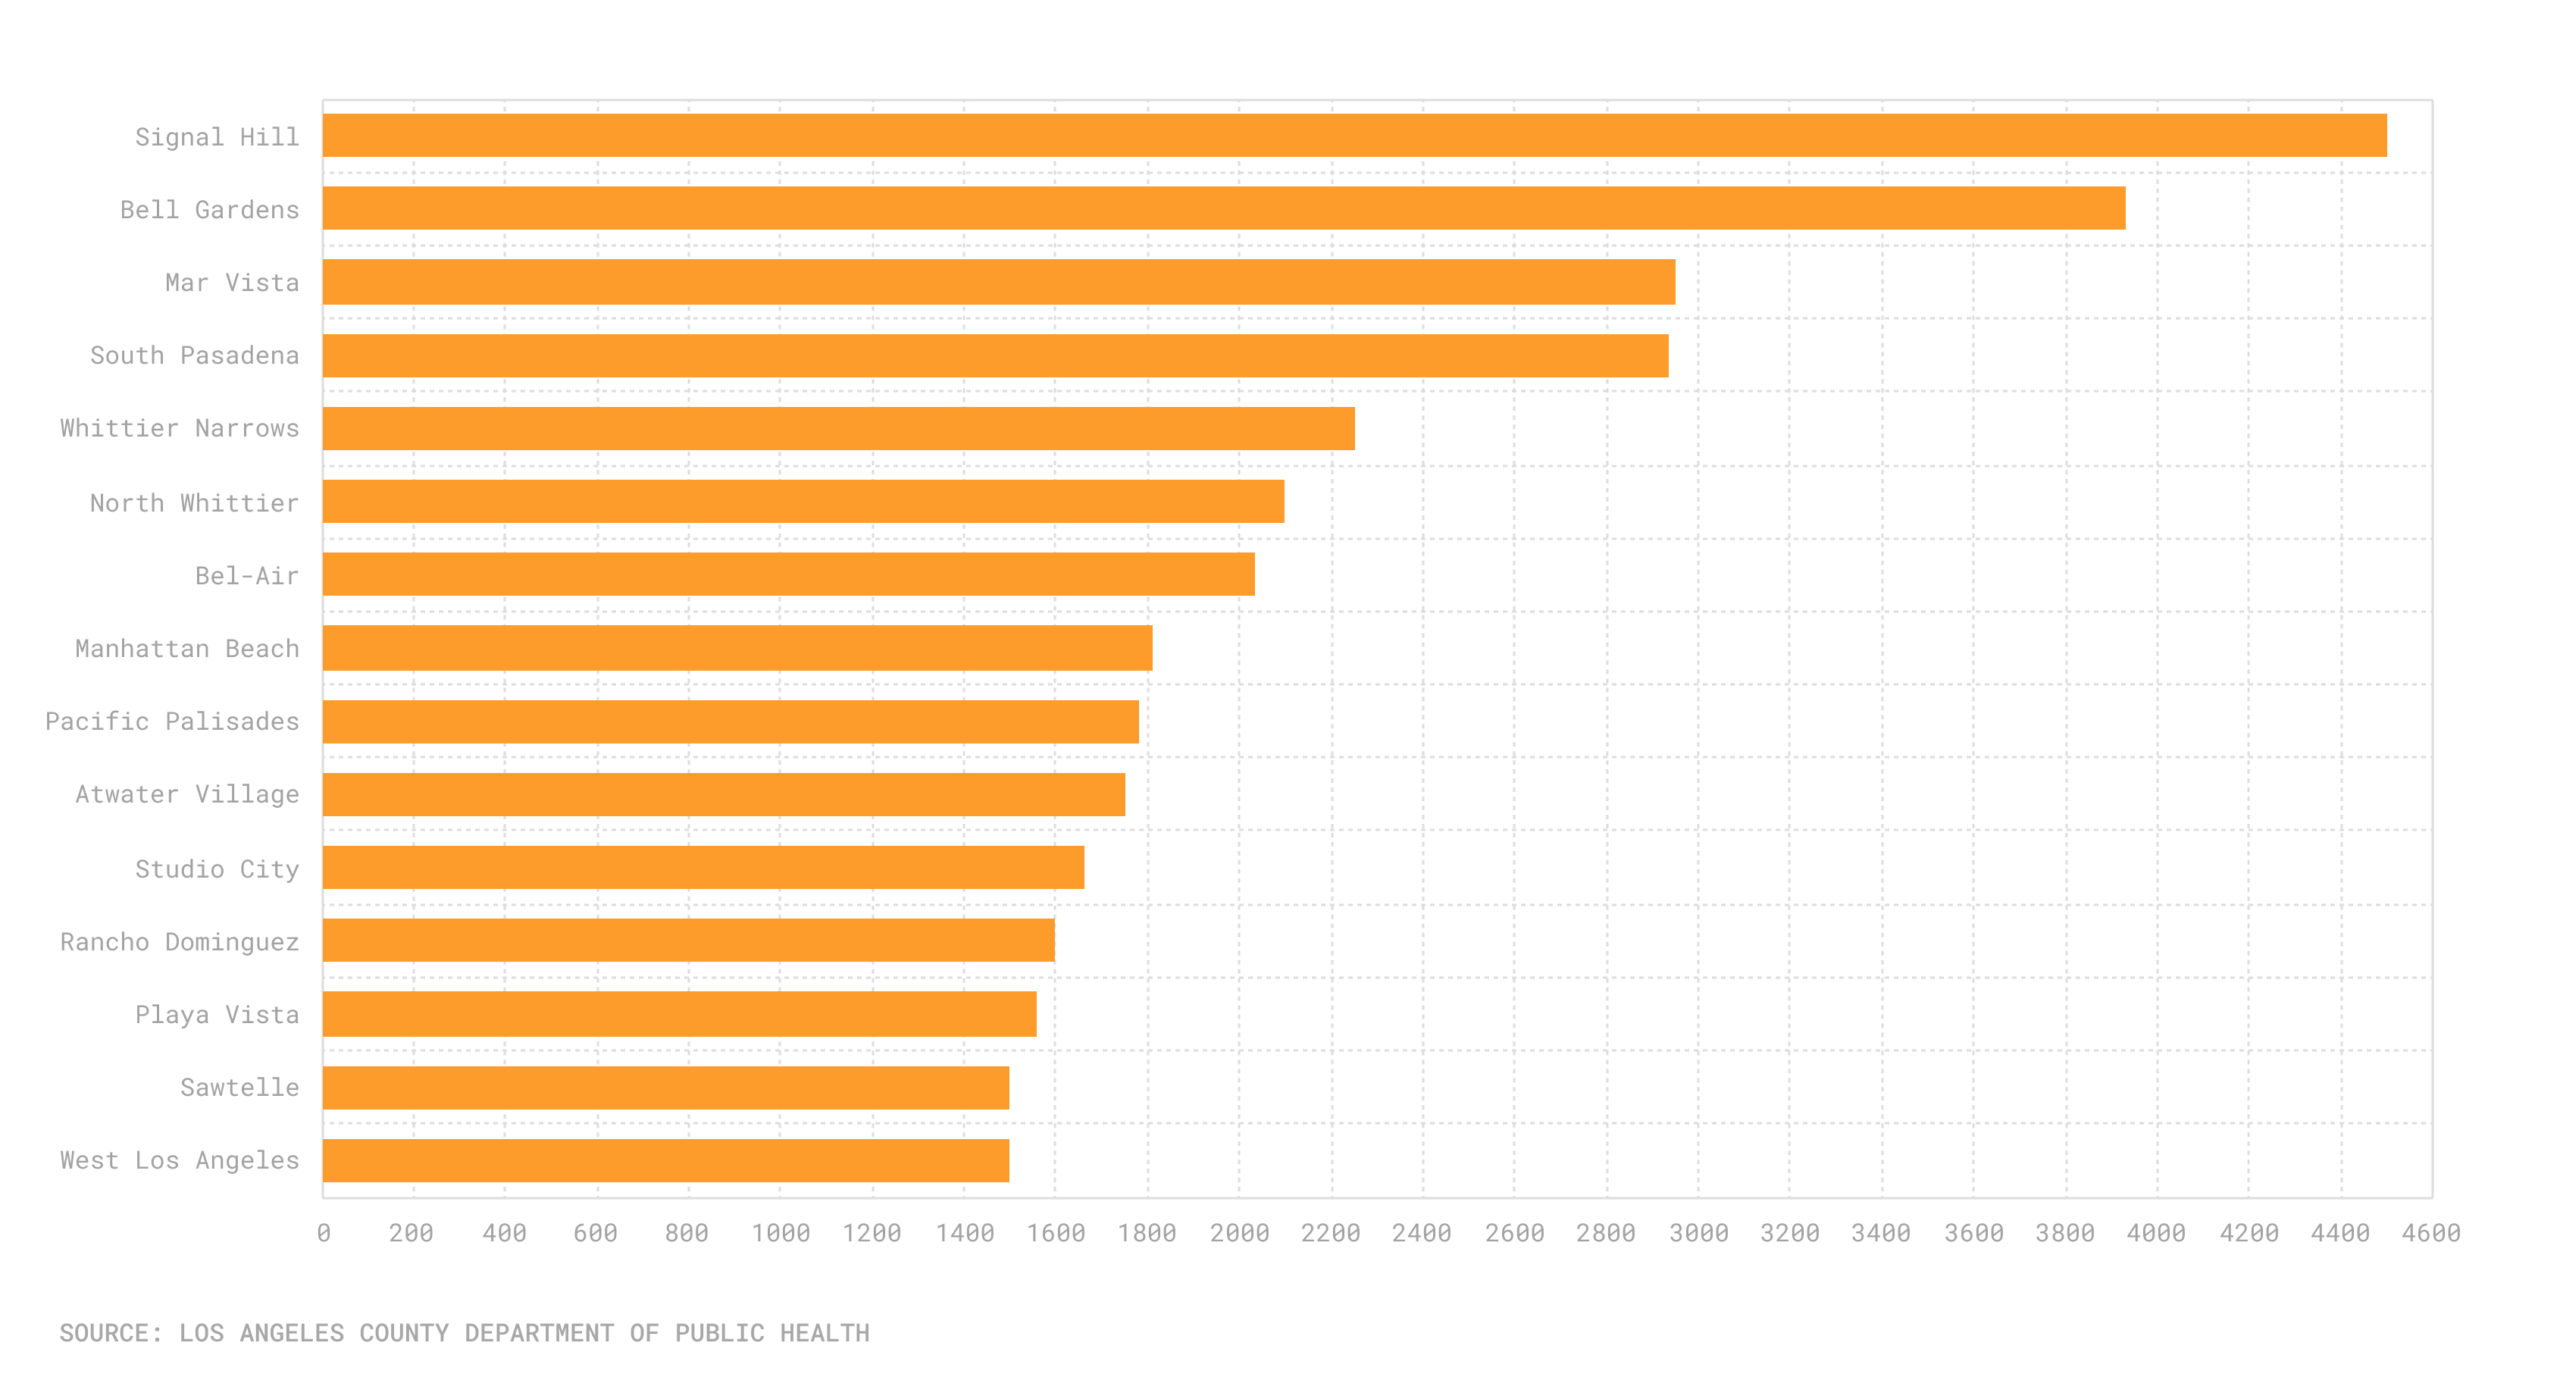
But this time around, it’s not just hitting the poorer, more densely populated communities that bore the brunt of the massive wave from last winter. Some of the places with the biggest increases are among Los Angeles’s wealthiest.
The well-off enclave of South Pasadena recorded just three cases in June. But in July, the number shot up to 91, an almost 30-fold increase. In Bel-Air, new cases jumped by 2,033%. In Manhattan Beach, the spike was 1,810%.
Signal Hill experienced the largest spike, at 4,500%.
Some of Los Angeles’s lower-income areas also made the list. For example, infections in Bell Gardens grew almost 40 times what they had been in June to 121 cases last month.
Biggest surges in COVID-19 cases, June vs. July 2021
A tale of two surges
Dr. Neeraj Sood, a professor at the USC Price School of Public Policy and a founding member of the USC Schaeffer Center for Health Policy and Economics, said that there no longer seems to be as wide of a gap of new COVID-19 cases between lower- and higher-income areas of Los Angeles County.
“Poorer areas had much higher exposure to past infection because people live in more crowded places, people were more likely to be essential workers, more likely to take public transportation,” Sood said. “You are much less likely to be reinfected if you have already been infected, especially if that past infection was in the last six months or so, even for the delta variant.”
[Get COVID-19, crime and other stats about where you live with the Crosstown Neighborhood Newsletter]
These past infections have added to the strength of immunity, which is why neighborhoods that had seen a surge in the past are not necessarily seeing the same kind of rise during this current wave of infections. People from wealthier areas, who perhaps had the privilege of working from home and staying more sedentary during the worst periods of COVID-19, have likely changed their behavior more, especially since California’s reopening on Jun. 15.
“Maybe that announcement didn’t do anything to the poorer areas but it changed behavior in the richer areas and therefore you see higher incidence of disease,” Sood said.
A youth-based spread
The recent spike is hitting young individuals in Los Angeles County, Barbara Ferrer, director of public health for LA County, said on July. 28.
“With the highest case rates occurring among people ages 18 to 49 years old, who comprise much of our workforce, workplaces can easily contribute to the spread of the virus,” she said. “Unvaccinated employees interacting with other workers or the public, are at elevated risk for COVID infection that can then spread easily from worksite to family members and to community residents.”
At the very beginning of the pandemic, way back in the spring of 2020, testing for COVID-19 was scarce. That is why – when the new cases spiked – the hot spots appeared to be in wealthier areas of Los Angeles, where people had more time, money and resources to access the testing sites. Then, there came the spike in lower-income areas, as infections in wealthier areas stabilized. This had a fatal effect, as these lower-income communities – such as San Fernando Valley, South L.A. and the southeastern parts of the county – were some of the hardest-hit areas during the winter surge.
Infections slowed overall after the vaccination rollout this spring. But now, the wealth divide is back – new cases are rising in higher-income communities once again.
Rising hospitalizations
Since June 15, there has been a 397.4% jump in COVID-19 hospitalizations, according to state data. The majority of these have been from the unvaccinated community. However, indoor mask mandates have made a return, and the city of Los Angeles is even considering proof of vaccination for those entering restaurants and other indoor events. These regulations are coming back, as a small portion of vaccinated people also have experienced breakthrough infections and can potentially still spread the virus. The overwhelming majority of new infections are among unvaccinated individuals.
“Even though there have been breakthrough infections, there is still a lot of evidence that vaccines do prevent infections,” Dr. Sood said. “They’re pretty good at that and even better at preventing hospitalizations or death.”
In June, Lancaster recorded the highest number of new cases with 380, while Palmdale had 376 and Santa Clarita had 240. But those numbers spiked up in July, with Santa Clarita recording 1,372 new cases, North Hollywood recording 1,122 and Glendale with 1,104.
“We are finding that unvaccinated and partially vaccinated people are nearly four times more likely to get infected than fully vaccinated individuals,” Ferrer said on Wednesday.
To date, the coronavirus total of LA County is now 1,307,970 and 24,704 reported deaths.
Change in caseloads by community
Search the table to see how your community was hit by the recent surge.
| Neighborhood |
New Cases in June
|
New Cases in July
|
% Change | |||
| Acton | 19 | 30 | 57.89474 | |||
|
Adams Normandie
|
8 | 24 | 200 | |||
| Agoura Hills | 17 | 92 | 441.1765 | |||
| Agua Dulce | 8 | 21 | 162.5 | |||
| Alhambra | 33 | 297 | 800 | |||
| Alondra Park | 5 | 36 | 620 | |||
| Altadena | 17 | 189 | 1011.765 | |||
| Angeles Crest | 0 | 8 | ||||
| Arcadia | 32 | 168 | 425 | |||
| Arleta | 20 | 148 | 640 | |||
|
Arlington Heights
|
9 | 40 | 344.4444 | |||
| Artesia | 8 | 68 | 750 | |||
| Atwater Village | 4 | 74 | 1750 | |||
|
Avocado Heights
|
4 | 48 | 1100 | |||
| Azusa | 25 | 195 | 680 | |||
|
Baldwin Hillscrenshaw
|
42 | 245 | 483.3333 | |||
| Baldwin Park | 49 | 252 | 414.2857 | |||
| Bel-Air | 3 | 64 | 2033.333 | |||
| Bell | 18 | 132 | 633.3333 | |||
| Bell Gardens | 3 | 121 | 3933.333 | |||
| Bellflower | 57 | 495 | 768.4211 | |||
| Beverly Crest | 18 | 90 | 400 | |||
| Beverly Grove | 21 | 193 | 819.0476 | |||
| Beverly Hills | 33 | 359 | 987.8788 | |||
| Beverlywood | 10 | 97 | 870 | |||
| Boyle Heights | 39 | 273 | 600 | |||
| Brentwood | 17 | 209 | 1129.412 | |||
|
Broadway Manchester
|
61 | 307 | 403.2787 | |||
| Burbank | 45 | 605 | 1244.444 | |||
| Calabasas | 19 | 134 | 605.2632 | |||
| Canoga Park | 60 | 270 | 350 | |||
| Carson | 61 | 498 | 716.3934 | |||
| Carthay | 21 | 193 | 819.0476 | |||
| Castaic | 29 | 154 | 431.0345 | |||
| Castaic Canyons | 12 | 109 | 808.3333 | |||
|
Central Alameda
|
33 | 178 | 439.3939 | |||
| Century City | 8 | 75 | 837.5 | |||
| Cerritos | 19 | 147 | 673.6842 | |||
| Charter Oak | 6 | 56 | 833.3333 | |||
| Chatsworth | 60 | 219 | 265 | |||
|
Chatsworth Reservoir
|
24 | 253 | 954.1667 | |||
|
Chesterfield Square
|
36 | 233 | 547.2222 | |||
| Cheviot Hills | 4 | 56 | 1300 | |||
| Chinatown | 5 | 57 | 1040 | |||
| Citrus | 9 | 47 | 422.2222 | |||
| Claremont | 12 | 96 | 700 | |||
| Commerce | 7 | 72 | 928.5714 | |||
| Compton | 90 | 552 | 513.3333 | |||
| Covina | 47 | 244 | 419.1489 | |||
| Cudahy | 18 | 103 | 472.2222 | |||
| Culver City | 17 | 219 | 1188.235 | |||
| Cypress Park | 7 | 102 | 1357.143 | |||
| Del Aire | 7 | 58 | 728.5714 | |||
| Del Rey | 14 | 218 | 1457.143 | |||
|
Desert View Highlands
|
9 | 11 | 22.22222 | |||
| Diamond Bar | 24 | 180 | 650 | |||
| Downey | 64 | 565 | 782.8125 | |||
| Downtown | 62 | 755 | 1117.742 | |||
| Duarte | 9 | 87 | 866.6667 | |||
| Eagle Rock | 19 | 175 | 821.0526 | |||
| East Compton | 8 | 74 | 825 | |||
| East Hollywood | 10 | 143 | 1330 | |||
| East La Mirada | 7 | 37 | 428.5714 | |||
|
East Los Angeles
|
81 | 381 | 370.3704 | |||
| East Pasadena | 1 | 4 | 300 | |||
| East San Gabriel | 15 | 49 | 226.6667 | |||
| Echo Park | 37 | 305 | 724.3243 | |||
| El Monte | 50 | 330 | 560 | |||
| El Segundo | 13 | 95 | 630.7692 | |||
| El Sereno | 13 | 175 | 1246.154 | |||
| Elysian Park | 0 | 34 | ||||
| Elysian Valley | 6 | 38 | 533.3333 | |||
| Encino | 22 | 312 | 1318.182 | |||
| Exposition Park | 35 | 246 | 602.8571 | |||
| Fairfax | 40 | 548 | 1270 | |||
| Florence | 24 | 188 | 683.3333 | |||
|
Florence Firestone
|
46 | 220 | 378.2609 | |||
| Gardena | 39 | 351 | 800 | |||
| Glassell Park | 20 | 109 | 445 | |||
| Glendale | 109 | 1104 | 912.844 | |||
| Glendora | 20 | 212 | 960 | |||
| Gramercy Park | 19 | 111 | 484.2105 | |||
| Granada Hills | 62 | 379 | 511.2903 | |||
|
Green Meadows
|
61 | 307 | 403.2787 | |||
| Green Valley | 12 | 109 | 808.3333 | |||
| Griffith Park | 18 | 200 | 1011.111 | |||
|
Hacienda Heights
|
23 | 177 | 669.5652 | |||
| Hancock Park | 8 | 113 | 1312.5 | |||
| Hansen Dam | 5 | 65 | 1200 | |||
| Harbor City | 22 | 186 | 745.4545 | |||
|
Harbor Gateway
|
39 | 233 | 497.4359 | |||
| Harvard Heights | 5 | 68 | 1260 | |||
| Harvard Park | 36 | 233 | 547.2222 | |||
| Hasley Canyon | 29 | 154 | 431.0345 | |||
|
Hawaiian Gardens
|
11 | 75 | 581.8182 | |||
| Hawthorne | 70 | 535 | 664.2857 | |||
| Hermosa Beach | 17 | 145 | 752.9412 | |||
| Hidden Hills | 1 | 12 | 1100 | |||
| Highland Park | 31 | 223 | 619.3548 | |||
|
Historic South Central
|
21 | 110 | 423.8095 | |||
| Hollywood | 51 | 749 | 1368.627 | |||
| Hollywood Hills | 20 | 269 | 1245 | |||
|
Hollywood Hills West
|
20 | 269 | 1245 | |||
|
Huntington Park
|
12 | 179 | 1391.667 | |||
| Hyde Park | 42 | 262 | 523.8095 | |||
| Industry | 0 | 1 | ||||
| Inglewood | 169 | 973 | 475.7396 | |||
| Irwindale | 1 | 5 | 400 | |||
| Jefferson Park | 8 | 45 | 462.5 | |||
| Koreatown | 39 | 558 | 1330.769 | |||
|
La Cañada Flintridge
|
6 | 64 | 966.6667 | |||
|
La Crescenta-Montrose
|
15 | 64 | 326.6667 | |||
|
La Habra Heights
|
3 | 4 | 33.33333 | |||
| La Mirada | 19 | 187 | 884.2105 | |||
| La Puente | 22 | 147 | 568.1818 | |||
| La Verne | 18 | 98 | 444.4444 | |||
| Ladera Heights | 10 | 61 | 510 | |||
| Lake Balboa | 26 | 244 | 838.4615 | |||
|
Lake Los Angeles
|
23 | 50 | 117.3913 | |||
|
Lake View Terrace
|
5 | 65 | 1200 | |||
| Lakewood | 51 | 494 | 868.6275 | |||
| Lancaster | 380 | 1029 | 170.7895 | |||
| Larchmont | 40 | 548 | 1270 | |||
| Lawndale | 19 | 158 | 731.5789 | |||
| Leimert Park | 10 | 136 | 1260 | |||
| Lennox | 12 | 69 | 475 | |||
| Leona Valley | 3 | 8 | 166.6667 | |||
| Lincoln Heights | 11 | 147 | 1236.364 | |||
| Littlerock | 2 | 7 | 250 | |||
| Lomita | 17 | 64 | 276.4706 | |||
| Long Beach | 291 | 2216 | 661.512 | |||
|
Lopezkagel Canyons
|
1 | 8 | 700 | |||
| Los Feliz | 18 | 200 | 1011.111 | |||
| Lynwood | 29 | 324 | 1017.241 | |||
| Malibu | 7 | 66 | 842.8571 | |||
|
Manchester Square
|
5 | 70 | 1300 | |||
|
Manhattan Beach
|
10 | 191 | 1810 | |||
| Mar Vista | 10 | 305 | 2950 | |||
| Marina Del Rey | 9 | 103 | 1044.444 | |||
|
Mayflower Village
|
6 | 71 | 1083.333 | |||
| Maywood | 10 | 91 | 810 | |||
| Mid City | 37 | 400 | 981.0811 | |||
| Mid-Wilshire | 24 | 339 | 1312.5 | |||
| Mission Hills | 27 | 166 | 514.8148 | |||
| Monrovia | 27 | 135 | 400 | |||
| Montebello | 43 | 247 | 474.4186 | |||
|
Montecito Heights
|
11 | 147 | 1236.364 | |||
| Monterey Park | 21 | 164 | 680.9524 | |||
|
Mount Washington
|
7 | 102 | 1357.143 | |||
| North El Monte | 32 | 168 | 425 | |||
| North Hills | 44 | 261 | 493.1818 | |||
|
North Hollywood
|
135 | 1122 | 731.1111 | |||
| North Whittier | 3 | 66 | 2100 | |||
|
Northeast Antelope Valley
|
11 | 20 | 81.81818 | |||
| Northridge | 58 | 441 | 660.3448 | |||
|
Northwest Antelope Valley
|
3 | 8 | 166.6667 | |||
|
Northwest Palmdale
|
8 | 14 | 75 | |||
| Norwalk | 52 | 478 | 819.2308 | |||
| Pacific Palisades | 6 | 113 | 1783.333 | |||
| Pacoima | 89 | 322 | 261.7978 | |||
| Palmdale | 376 | 827 | 119.9468 | |||
| Palms | 20 | 251 | 1155 | |||
|
Palos Verdes Estates
|
7 | 52 | 642.8571 | |||
| Panorama City | 59 | 349 | 491.5254 | |||
| Paramount | 29 | 285 | 882.7586 | |||
| Pasadena | 57 | 530 | 829.8246 | |||
| Pico Rivera | 32 | 232 | 625 | |||
| Pico Robertson | 4 | 59 | 1375 | |||
| Pico Union | 14 | 127 | 807.1429 | |||
| Playa Del Rey | 0 | 21 | ||||
| Playa Vista | 5 | 83 | 1560 | |||
| Pomona | 136 | 740 | 444.1176 | |||
| Porter Ranch | 39 | 203 | 420.5128 | |||
| Quartz Hill | 28 | 69 | 146.4286 | |||
|
Rancho Dominguez
|
2 | 34 | 1600 | |||
|
Rancho Palos Verdes
|
14 | 139 | 892.8571 | |||
| Rancho Park | 10 | 52 | 420 | |||
| Redondo Beach | 22 | 324 | 1372.727 | |||
| Reseda | 75 | 445 | 493.3333 | |||
| Ridge Route | 29 | 154 | 431.0345 | |||
| Rolling Hills | 1 | 8 | 700 | |||
|
Rolling Hills Estates
|
3 | 45 | 1400 | |||
| Rosemead | 9 | 106 | 1077.778 | |||
|
Rowland Heights
|
11 | 96 | 772.7273 | |||
| San Dimas | 13 | 128 | 884.6154 | |||
| San Fernando | 28 | 136 | 385.7143 | |||
| San Gabriel | 19 | 87 | 357.8947 | |||
| San Marino | 5 | 12 | 140 | |||
| San Pedro | 61 | 447 | 632.7869 | |||
| Santa Clarita | 240 | 1372 | 471.6667 | |||
|
Santa Fe Springs
|
8 | 94 | 1075 | |||
| Santa Monica | 45 | 625 | 1288.889 | |||
| Sawtelle | 17 | 272 | 1500 | |||
|
Sepulveda Basin
|
22 | 312 | 1318.182 | |||
| Shadow Hills | 4 | 31 | 675 | |||
| Sherman Oaks | 65 | 721 | 1009.231 | |||
| Sierra Madre | 5 | 39 | 680 | |||
| Signal Hill | 2 | 92 | 4500 | |||
| Silver Lake | 21 | 295 | 1304.762 | |||
|
South Diamond Bar
|
11 | 96 | 772.7273 | |||
| South El Monte | 7 | 60 | 757.1429 | |||
| South Gate | 82 | 478 | 482.9268 | |||
| South Park | 25 | 146 | 484 | |||
| South Pasadena | 3 | 91 | 2933.333 | |||
|
South San Gabriel
|
0 | 16 | ||||
|
South San Jose Hills
|
7 | 68 | 871.4286 | |||
| South Whittier | 20 | 220 | 1000 | |||
|
Southeast Antelope Valley
|
18 | 30 | 66.66667 | |||
|
Stevenson Ranch
|
22 | 118 | 436.3636 | |||
| Studio City | 11 | 194 | 1663.636 | |||
| Sun Valley | 43 | 279 | 548.8372 | |||
| Sun Village | 11 | 19 | 72.72727 | |||
| Sunland | 15 | 95 | 533.3333 | |||
| Sylmar | 79 | 512 | 548.1013 | |||
| Tarzana | 18 | 156 | 766.6667 | |||
| Temple City | 10 | 63 | 530 | |||
| Toluca Lake | 14 | 98 | 600 | |||
| Topanga | 13 | 78 | 500 | |||
| Torrance | 101 | 519 | 413.8614 | |||
| Tujunga | 15 | 128 | 753.3333 | |||
|
Unincorporated Catalina Island
|
0 | 6 | ||||
|
Unincorporated Santa Monica Mountains
|
13 | 78 | 500 | |||
|
Unincorporated Santa Susana Mountains
|
4 | 16 | 300 | |||
| University Park | 21 | 120 | 471.4286 | |||
| Val Verde | 2 | 16 | 700 | |||
| Valinda | 15 | 95 | 533.3333 | |||
| Valley Glen | 24 | 186 | 675 | |||
| Valley Village | 17 | 203 | 1094.118 | |||
| Van Nuys | 75 | 469 | 525.3333 | |||
| Venice | 33 | 364 | 1003.03 | |||
| Vermont Knolls | 13 | 102 | 684.6154 | |||
|
Vermont Slauson
|
36 | 233 | 547.2222 | |||
|
Vermont Square
|
63 | 342 | 442.8571 | |||
| Vermont Vista | 43 | 293 | 581.3953 | |||
| Vernon | 0 | 5 | ||||
|
Veterans Administration
|
7 | -35 | -600 | |||
|
View Park Windsor Hills
|
18 | 86 | 377.7778 | |||
| Walnut | 9 | 80 | 788.8889 | |||
| Walnut Park | 7 | 46 | 557.1429 | |||
| Watts | 38 | 231 | 507.8947 | |||
| West Adams | 38 | 354 | 831.5789 | |||
| West Carson | 26 | 99 | 280.7692 | |||
| West Compton | 3 | 41 | 1266.667 | |||
| West Covina | 51 | 485 | 850.9804 | |||
| West Hills | 24 | 253 | 954.1667 | |||
|
West Hollywood
|
37 | 556 | 1402.703 | |||
|
West Los Angeles
|
17 | 272 | 1500 | |||
|
West Puente Valley
|
12 | 77 | 541.6667 | |||
|
West Whittier Los Nietos
|
17 | 102 | 500 | |||
| Westchester | 31 | 331 | 967.7419 | |||
| Westlake | 54 | 321 | 494.4444 | |||
|
Westlake Village
|
3 | 10 | 233.3333 | |||
| Westmont | 42 | 293 | 597.619 | |||
| Westwood | 18 | 272 | 1411.111 | |||
| Whittier | 52 | 352 | 576.9231 | |||
| Willowbrook | 66 | 391 | 492.4242 | |||
| Wilmington | 40 | 259 | 547.5 | |||
| Windsor Square | 8 | 113 | 1312.5 | |||
| Winnetka | 52 | 247 | 375 | |||
| Woodland Hills | 65 | 474 | 629.2308 |
How we did it: We analyzed coronavirus data provided by the Los Angeles County Department of Public Health from June 1 through July 31, 2021.
Interested in our data? Check out the Crosstown coronavirus interactive map or email us at askus@xtown.la.


