Who Are the Victims of Gun Crimes in LA?
In the first six months of 2018, the Los Angeles Police reported 3,214 incidents of gun crimes. For the same period in 2017, there were 3,453.
This is the first installment in a series in which we’ll examine crime victims as described in LAPD crime report data.
Gun crimes, by our definition, are crimes for which LAPD lists a non-toy gun in the “Weapon Description” field in their public crime data. These crimes could range from brandishing a weapon or shots fired at an inhabited dwelling to intimate partner abuse or even homicide.
We looked at who the victims of these crimes were during the first half of 2018 and graphed them by categories provided by the LAPD: “Victim Gender” and “Victim Descent”:
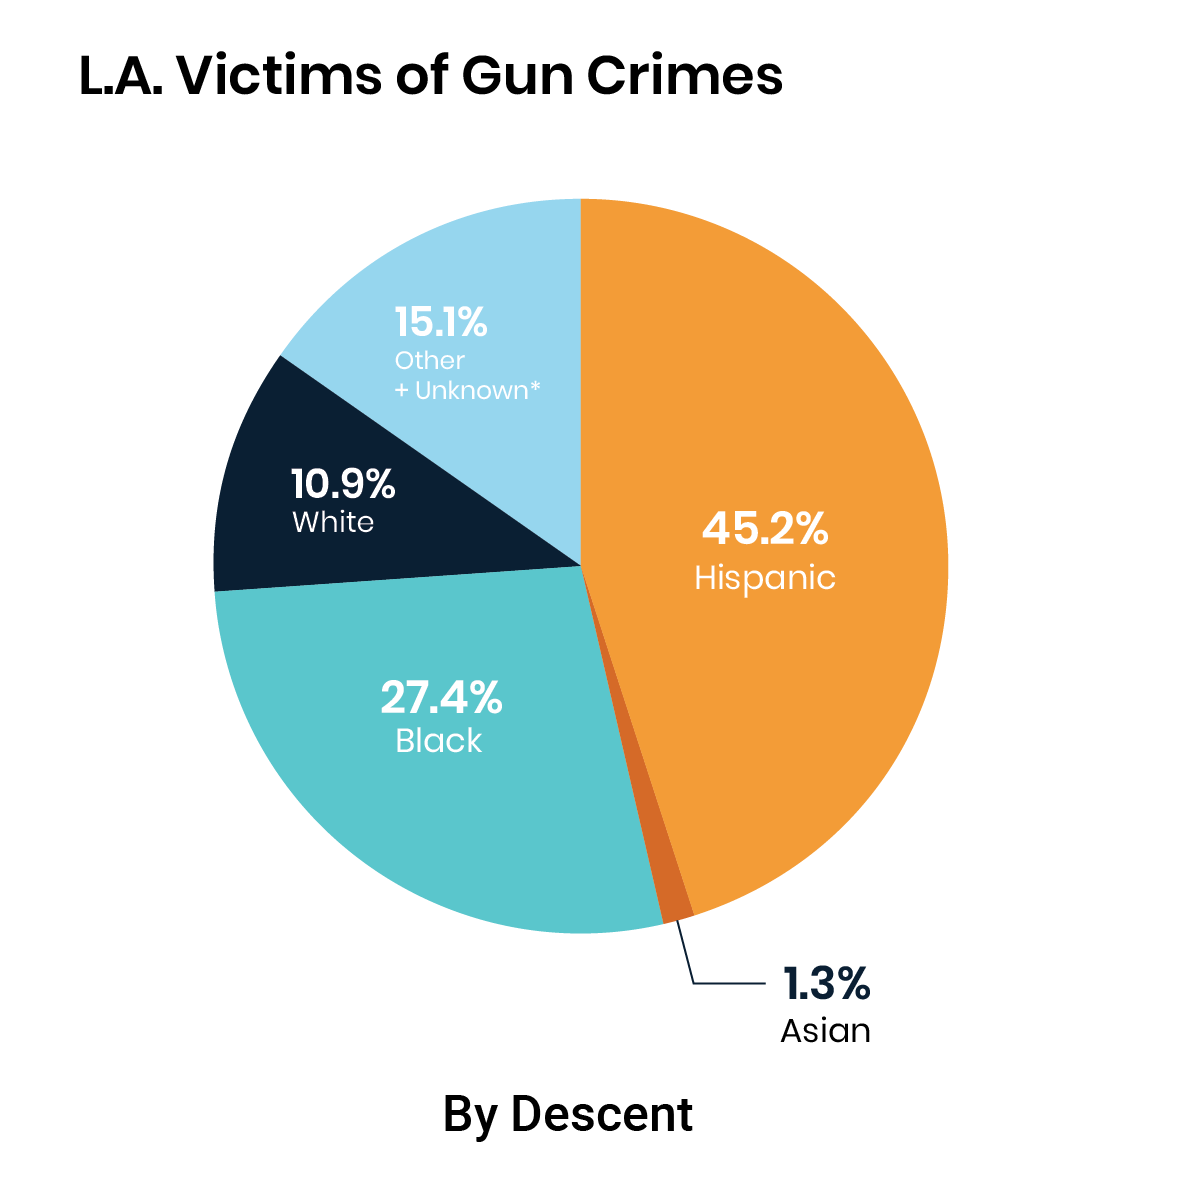
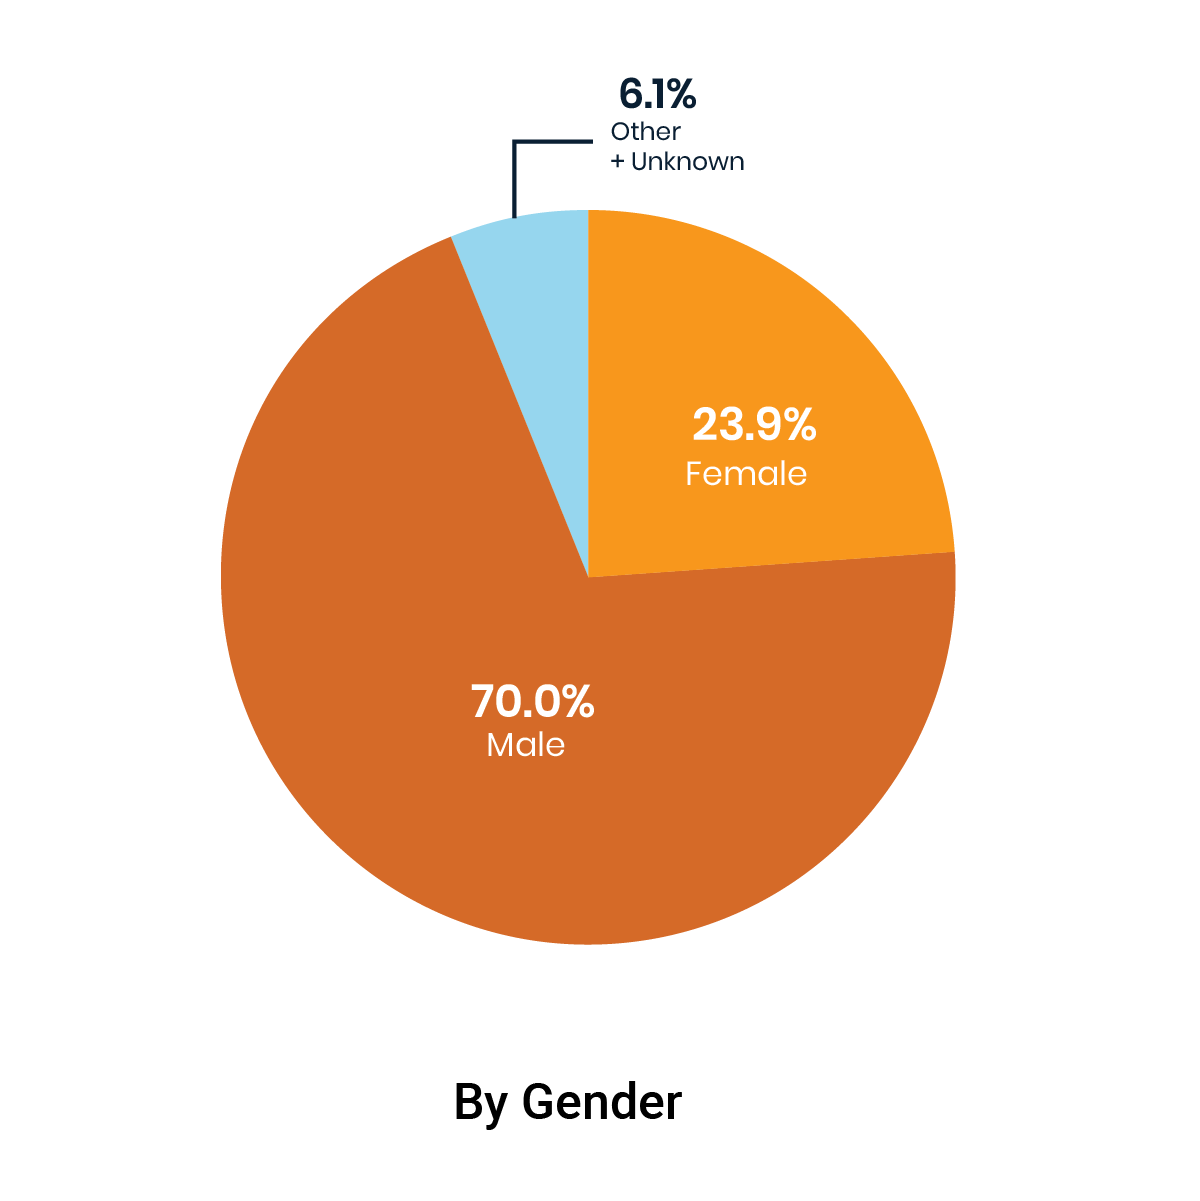
LAPD data offers more detail than shown in the charts. Their dataset documentation indicates that reporting officers can describe a victim using any of 11 categories of Asian descent (Chinese, Cambodian, Filipino, Japanese, Korean, Laotian, Pacific Islander, Samoan, Vietnamese, Asian Indian, and Other Asian). We decided to merge those categories into Asian because LAPD almost never uses most of them. The Other Asian category is by far the most commonly used on crime reports.
To put these gun crime numbers in context, here’s what demographic charts look like for victims of all crimes in LA, whether or not they involve guns:

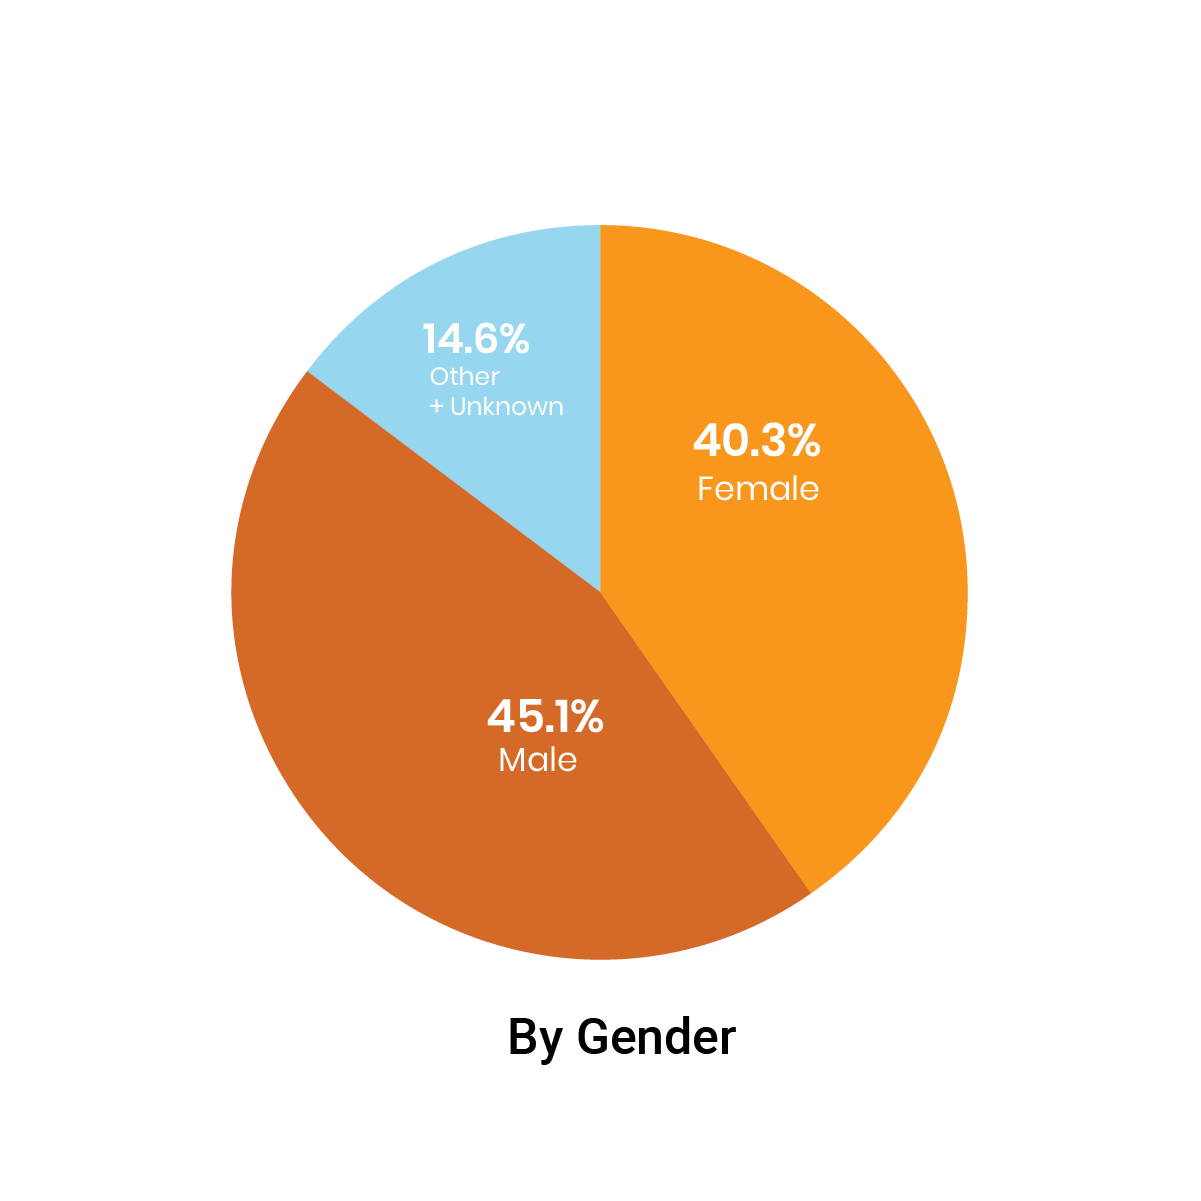
LAPD reported 110,942 crimes in the first half of 2018. Only 2.9% of them involved guns.
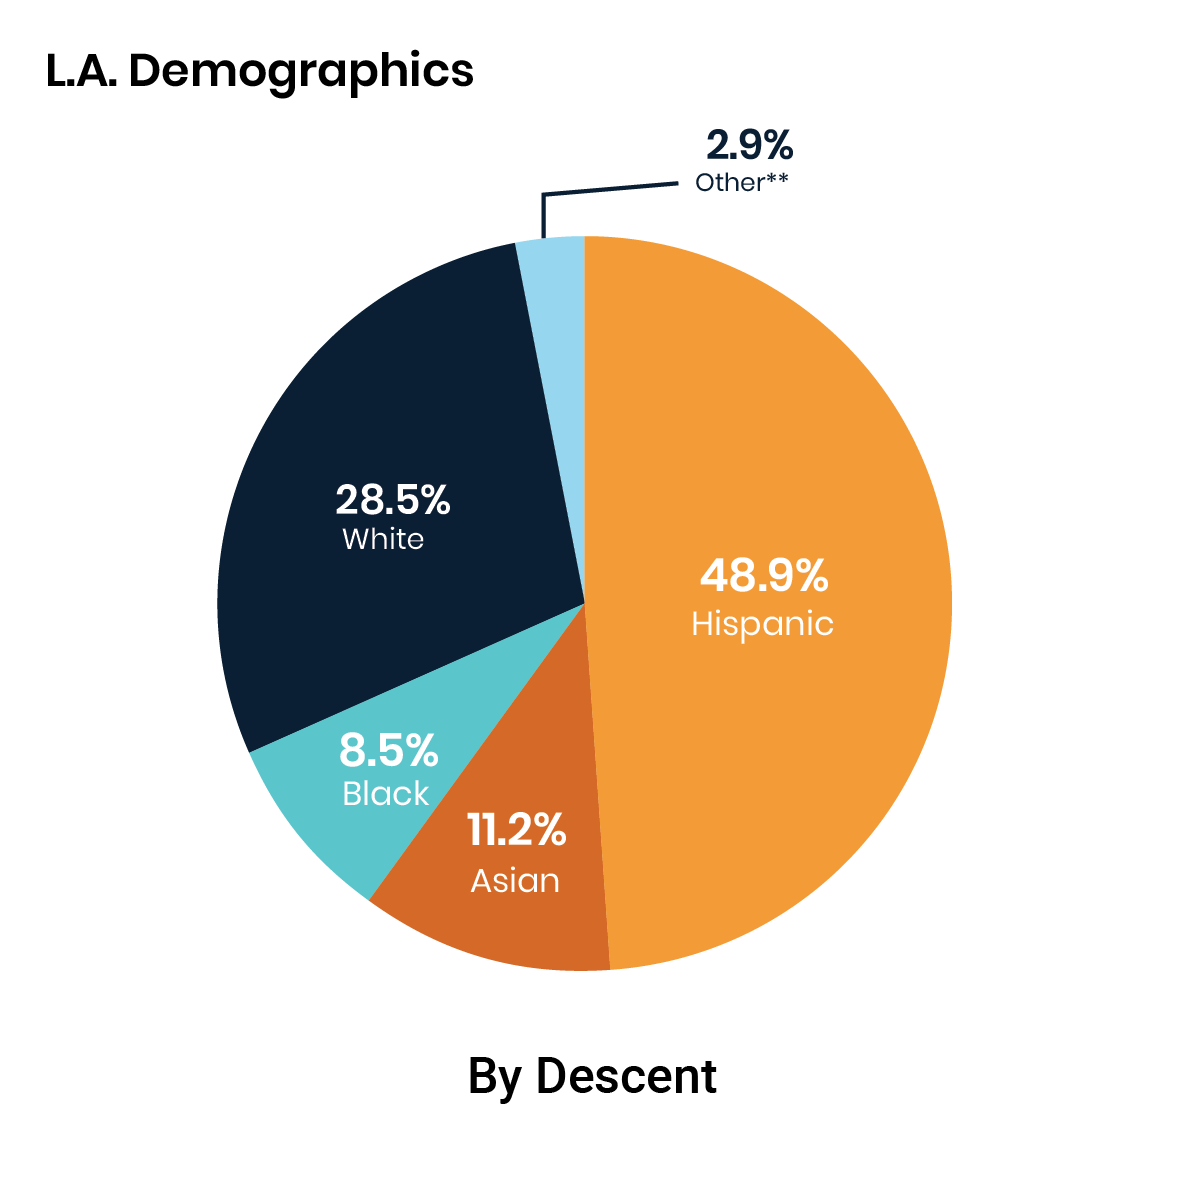
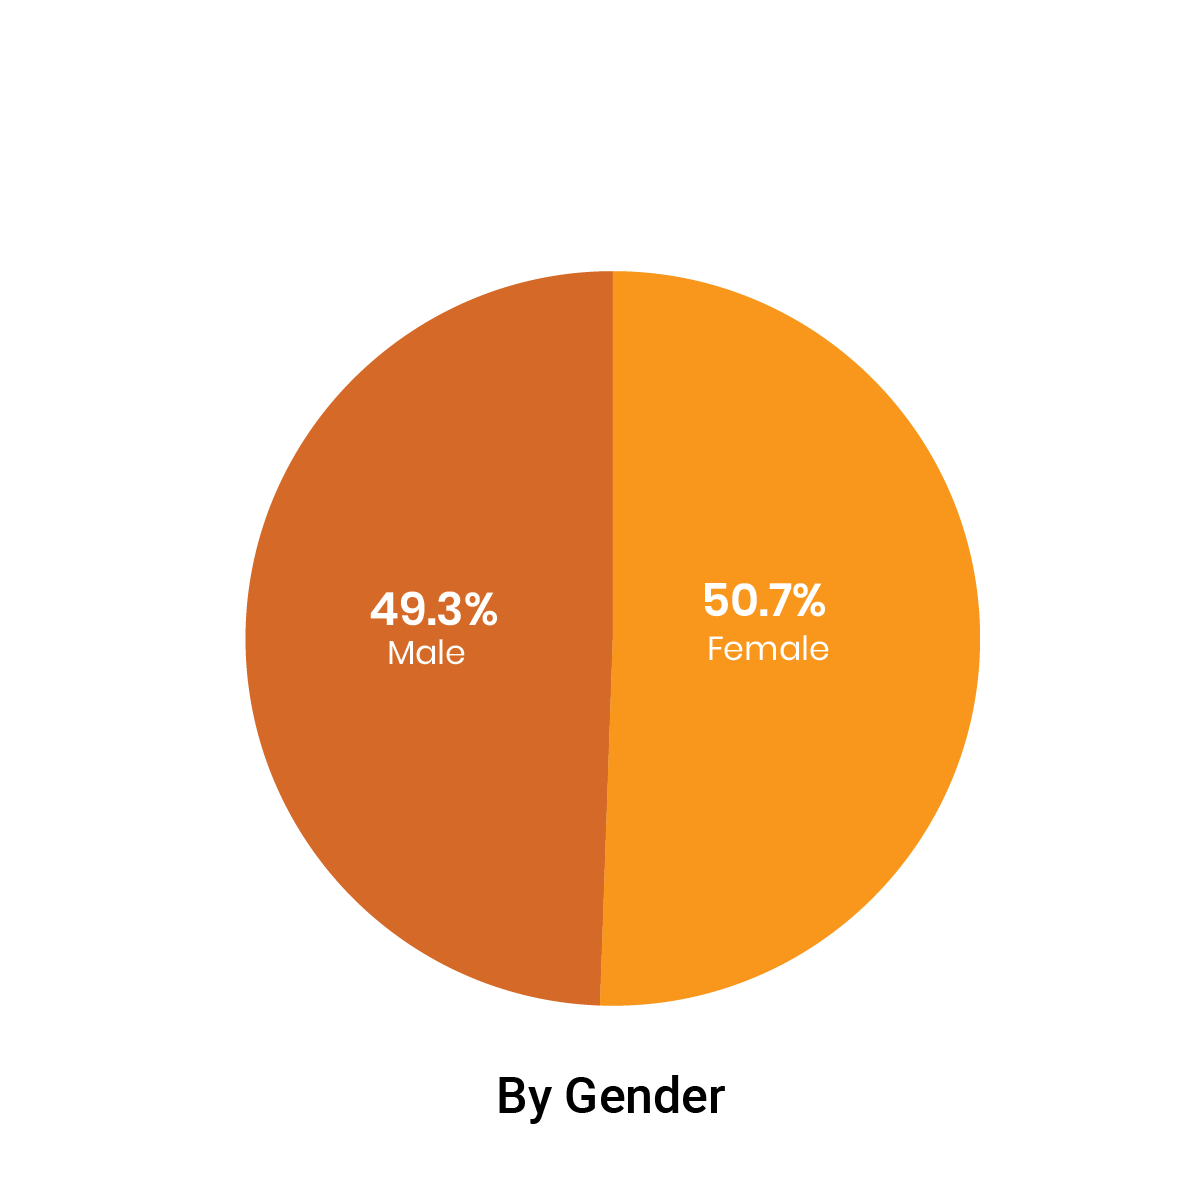
Zooming out further, here are gender and race (or “Descent,” as described by LAPD) charts representing all Los Angeles residents, according to the US Census Bureau’s 2016 American Community Survey:
In upcoming installments in this series, we will look at how victims of gun crimes are trending over the past several years and examine some of the crimes that are often committed with the help of guns, such as assault with deadly weapon, robbery at gunpoint, and a set of crimes that LAPD labels “shots fired.”
Want more data about victims of gun crimes? About victims of other crimes? If you have questions, comments, or other lines of inquiry you’d like to see us pursue, please write to us: askus@xtown.la.
* The pie slice we labeled Other + Unknown in the crime victims “By Descent” charts represent the sum of five categories in the LAPD data: Other, American Indian/Alaskan Native, Guamanian, Hawaiian, and Unknown.
** The Other slice in the “By Descent” pie chart represents the sum of four categories in the Census Bureau data: Other, Native, Islander, and Two+.


