Swimming pools: the haves and have-nots

Since 2013, the neighborhood of Sherman Oaks, in the Valley, received more than 1,000 permits to build new swimming pools. During that same period, the South Los Angeles neighborhood of Florence received just one pool permit.
The backyard pool is perhaps the ultimate symbol of Southern California living, offering a refreshing escape from the scorching summer heat. While it is no surprise that wealthier areas install more pools than low-income neighborhoods, the scale of the discrepancy is staggering, according to a Crosstown analysis of Department of Building and Safety data.
“We get a lot of calls about pools for the nice areas, but we barely get calls for the areas in the South Los Angeles neighborhoods,” said Steve Melkon, project manager for JMI Construction of Pasadena.
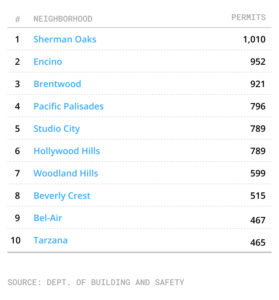
Neighborhoods known for single-family homes with ample backyard space have racked up an enormous number of pool approvals. From 2013-2019, 952 permits were issued in Encino, 921 were green-lit in Brentwood and 796 were granted for Pacific Palisades. (A permit does not guarantee that the pool was ultimately completed.)
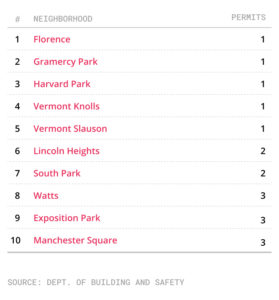
Yet in that same period, there were nine neighborhoods — many low-income and south of the 10 Freeway, like Vermont-Slauson — that were issued a single pool permit. The lone permit issued in Florence went to an employee of the contractor who built the pool.
Who gets a pool and who doesn’t in Los Angeles (2013-2019):
Neighborhoods with the highest/lowest number of pool permits


Affordability is a key factor in determining who gets a pool. But the haves and have-nots of pools also split along racial lines. Many of the neighborhoods that have seen a minuscule number of pool permits have large Black or Latino populations.
A wealth and racial divide
Who has access to a pool — and who doesn’t — is about more than just status. Increasingly, some parts of the city are suffering disproportionately from rising temperatures, leading to health issues and even heat-related deaths. These areas are often home to some of the city’s poorest, and have little in the way of tree cover or structures that provide shade. Last year, Mayor Eric Garcetti declared, “Shade is an equity issue.” He launched a program to plant trees, construct awnings over bus stops and provide other structures that give relief from the heat.
The typical cost to build a new pool in Los Angeles is between $40,000 and $80,000, according to All American Builders, which specializes in pool construction. Pool size, the type of pool and licensing fees all play a role in the cost.
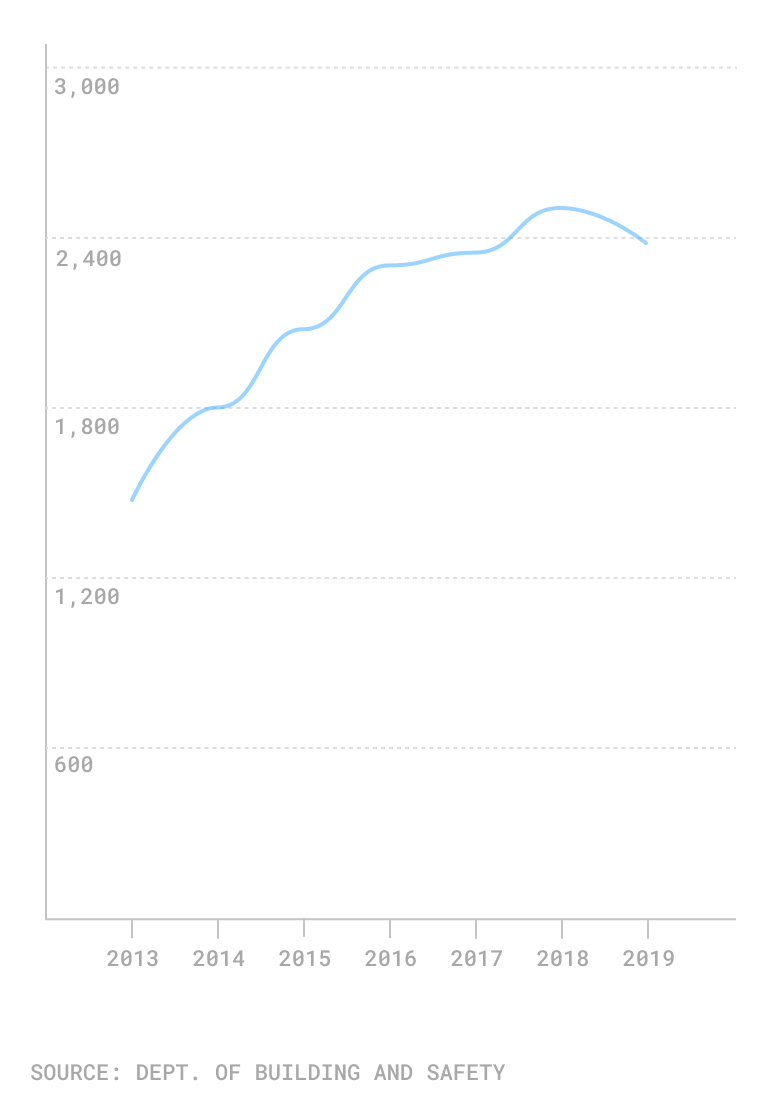
Pool permits issued in Los Angeles by year (2013-2019)

The greatest form of wealth for working and middle-class families is home equity, but the share of Black households that own their home was essentially unchanged between 1968 and 2018, according to a study released by the Economic Policy Institute. The report goes on to state that homeownership for white households increased 5.2 percentage points, to 71.1 percent during that period. That is about 30 percentage points higher than the ownership rate for Black households.
“Pools are a luxury item, so I’m sure there is also a correlation between the income level and affordability,” said Paul Chilopoulos, chief executive of Allstate Pools.
Watts, Historic South-Central and Vermont-Slauson recorded a combined 12 pool permits over the past seven years. These neighborhoods are among the densest in Los Angeles, with an average of 18,000 residents per square mile, according to U.S. census data.
Getting past DWP
But it’s not just small lots in dense areas that prevent pool construction. It’s also the prevalence and placement of power lines over small parcels, said Chilopoulos. According to the Los Angeles Department of Water and Power, no portion of water can be placed under high-voltage power lines.
“People decide they can’t put in a big enough pool, so they don’t want to spend the money. It can be a real bummer for people,” said Chilopoulos.
He added that smaller parcel sizes in dense areas also lead to access issues, particularly if there is less than four feet of space to get to the backyard along the side of a house.
“If I can’t get a tractor in the backyard to dig the pool it’s not cost-effective to dig it by hand,” he said.
Ellen Cheng, the media relations manager for the LADWP, said the department has consistent requirements for power line clearance for home construction projects across its service area, and the rules are universal throughout the city.
Increasingly, Chilopoulos said homeowners are opting to build accessory dwelling units — often referred to as granny flats — rather than pools, choosing to invest in a project that can produce a revenue stream. According to the city Department of Public Works, state rules that went into effect in 2017 made it easier for people to convert a garage into rentable units or build additional structures on their property. Chilopoulos said that the City of Los Angeles has “removed the handcuffs” when applying for ADUs.
Pool permits issued by neighborhood (2013-2019)
| Neighborhood |
No. of pool permits
|
| Central Alameda | 1 |
| Cypress Park | 1 |
| Elysian Park | 1 |
| Florence | 1 |
| Gramercy Park | 1 |
| Harvard Park | 1 |
| Vermont Knolls | 1 |
| Vermont Slauson | 1 |
| Griffith Park | 2 |
| Lincoln Heights | 2 |
| South Park | 2 |
| Exposition Park | 3 |
| Manchester Square | 3 |
| Watts | 3 |
| Chinatown | 4 |
| Leimert Park | 4 |
| Vermont Vista | 4 |
| Adams Normandie | 6 |
| University Park | 7 |
| Harbor City | 8 |
| Historic South-Central | 8 |
| West Adams | 8 |
| Boyle Heights | 10 |
| East Hollywood | 10 |
| Harvard Heights | 10 |
| Jefferson Park | 10 |
| Montecito Heights | 10 |
| El Sereno | 11 |
| Pacoima | 14 |
| Arlington Heights | 15 |
| Wilmington | 15 |
| Arleta | 16 |
| Glassell Park | 16 |
| Harbor Gateway | 16 |
| Panorama City | 16 |
| Playa del-Ray | 16 |
| Rancho Park | 17 |
| Century City | 19 |
| Hyde Park | 19 |
| Westlake | 19 |
| Highland Park | 25 |
| Mount Washington | 25 |
| Lake View Terrace | 28 |
| Mission Hills | 30 |
| Playa Vista | 30 |
| Conoga Park | 31 |
| Koreatown | 31 |
| Palms | 31 |
| Carthay | 33 |
| Baldwin Hills/Crenshaw | 35 |
| Atwater Village | 37 |
| Sunland | 39 |
| Pico Robertson | 41 |
| Sawtelle | 43 |
| San Pedro | 44 |
| Echo Park | 47 |
| Larchmont | 49 |
| North Hills | 54 |
| Reseda | 61 |
| Lake Balboa | 65 |
| Sun Valley | 67 |
| Winnetka | 67 |
| Tujunga | 70 |
| Del Ray | 71 |
| West Los Angeles | 71 |
| Shadow Hills | 84 |
| Sylmar | 84 |
| Eagle Rock | 86 |
| Mid City | 95 |
| North Hollywood | 99 |
| Porter Ranch | 105 |
| Van Nuys | 111 |
| Downtown | 115 |
| Mid Wilshire | 139 |
| Toluca Lake | 140 |
| Silver Lake | 156 |
| Beverlywood | 160 |
| Windsor Square | 160 |
| Hollywood | 175 |
| Westchester | 186 |
| Granada Hills | 187 |
| Northridge | 211 |
| Valley Glen | 214 |
| Cheviot Hills | 216 |
| Valley Village | 226 |
| West Hills | 234 |
| Fairfax | 258 |
| Venice | 264 |
| Hancock Park | 226 |
| Los Feliz | 270 |
| Westwood | 271 |
| Mar Vista | 275 |
| Hollywood Hills | 292 |
| Chatsworth | 327 |
| Beverly Grove | 416 |
| Tarzana | 465 |
| Bel Air | 467 |
| Beverly Crest | 515 |
| Woodland Hills | 599 |
| Hollywood Hills | 789 |
| Studio City | 789 |
| Pacific Palisades | 796 |
| Brentwood | 921 |
| Encino | 952 |
| Sherman Oaks | 1,010 |
How we did it: We examined the City of Los Angeles’s publicly available data on reported pool permit applications from Jan. 1, 2013 – Aug. 31, 2020. For neighborhood boundaries, we rely on the borders defined by the Los Angeles Times. Learn more about our data here.
In making our calculations, we rely on the data the Department of Building and Safety makes publicly available. On occasion, their department may update past permit applications with new information, or recategorize past permits. Those revised permits do not always automatically become part of the public database.
Want to know how your neighborhood fares? Or simply just interested in our data? Email us at askus@xtown.la.


