Auto collisions plummet in pandemic, but fatalities increase

On March 15, 2020, Los Angeles Mayor Eric Garcetti issued the lockdown order that shuttered bars, in-person service at restaurants and many businesses. The move also cleared streets and freeways, leading to many fewer collisions. But were the streets actually safer?
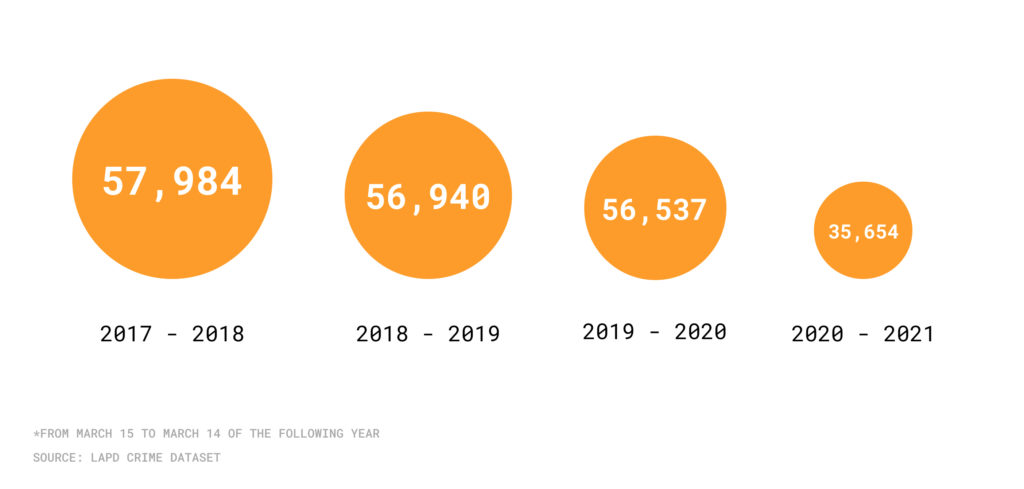
There were 35,654 vehicle collisions in the period that ran through March 14, 2021, a nearly 37% drop from the previous 12 months.
Annual number of collisions in Los Angeles, March 2017-March 2021

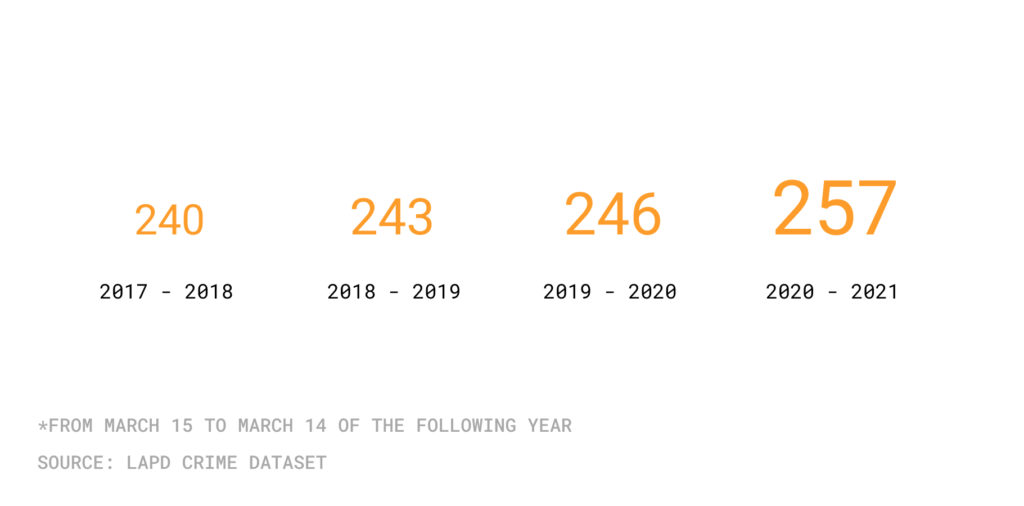
Yet despite tens of thousands of fewer incidents, the number of road fatalities actually rose, to 257 from March 15, 2020-March 14, 2021, according to Los Angeles Police Department data. That is a 4.4% increase from the previous 12-month period and a 7% rise over the 240 reported four years ago.
“This is an epidemic,” said Damian Kevitt, executive director of the nonprofit advocacy group Streets Are For Everyone. “There’s a responsibility for drivers to drive safely and every collision has a toll whether that’s an emotional one or losing productivity.”
Annual number of traffic fatalities in Los Angeles, March 2017-March 2021

Car collisions are the fourth leading cause of premature death in the county, according to a 2019 report from the Los Angeles County Department of Public Health. Local leaders have been seeking to make driving safer. In 2015, Garcetti launched the Vision Zero initiative, with the aim of eliminating traffic deaths by 2025. Steps to achieve that include enforcing safety-related traffic laws and seeking to reduce vehicle speed.
So why are the numbers rising?
Colin Sweeney, a spokesperson for the Los Angeles Department of Transportation, said that during the pandemic the city made “significant” street safety investments, including installing new street designs and signals, and upgrading crosswalks.
Despite those efforts, drivers responded to open roads by stepping on the gas. The past year revealed a “pandemic of speeding,” according to Sweeney. He and Kevitt both said they have heard of numerous collisions and other dangerous traffic incidents in South Los Angeles.
“These trends cement our need to maintain a data-driven approach that prioritizes investments in historically marginalized and under-resourced communities,” said Sweeney. “This includes prioritizing capital projects that create meaningful change for neighborhoods.”
One of those projects is on Avalon Boulevard in South Los Angeles, where 12 miles of protected bike lanes were installed. Sweeney said similar safety projects are happening along Broadway and Main Street in South Los Angeles.
Dangers for people experiencing homelessness
One particularly disturbing subset of the fatalities centered on a community that is already vulnerable. From March 15, 2020-March 14, 2021, 45 people experiencing homelessness died in a collision, slightly more than the 42 during the previous 12-month period.
That includes a 54-year-old Black woman who died last August. Police said it was a hit and run in the community of Broadway-Manchester.
Four years ago, the number of fatalities among people experiencing homelessness was 20.
Kevitt said bringing about change can be slow given longstanding trends in an auto-centric region.
“There are ways to design roads so they are safer, but unfortunately many were designed for speed and not the safety of the community,” he said
One tool is “traffic calming.” The LADOT has a program allowing residents to apply to have speed humps installed on residential streets. However, it is a slow process, and due to budget constraints, the application system has been delayed.
Fatalities were down in the pandemic year for Hispanic, white and Asian people. But the 63 Black people who died in a collision were up 75% from the 36 in the prior 12 months.
Collision fatalities also increased for men: 185 died, compared to 172 during the previous 12-month period. The 61 women who died in collisions is down from 67 during the previous 12 months.
How we did it: We examined traffic data from the Los Angeles Police Department from March 15, 2017-March 14, 2021. For neighborhood boundaries, we rely on the borders defined by the Los Angeles Times. Learn more about our data here.
LAPD data only reflects crimes that are reported to the department, not how many crimes actually occurred. In making our calculations, we rely on the data the LAPD makes publicly available. LAPD may update past crime reports with new information, or recategorize past reports. Those revised reports do not always automatically become part of the public database.
Want to know how your neighborhood fares? Or simply just interested in our data? Email us at askus@xtown.la.


