The Crosstown COVID Tracker
In Los Angeles, the light at the end of the COVID-19 tunnel is getting closer by the day. In order to help you keep track of the progress, we compile a weekly rundown of the most important local data on vaccinations, positivity rates, new cases, and hospitalizations across the county.
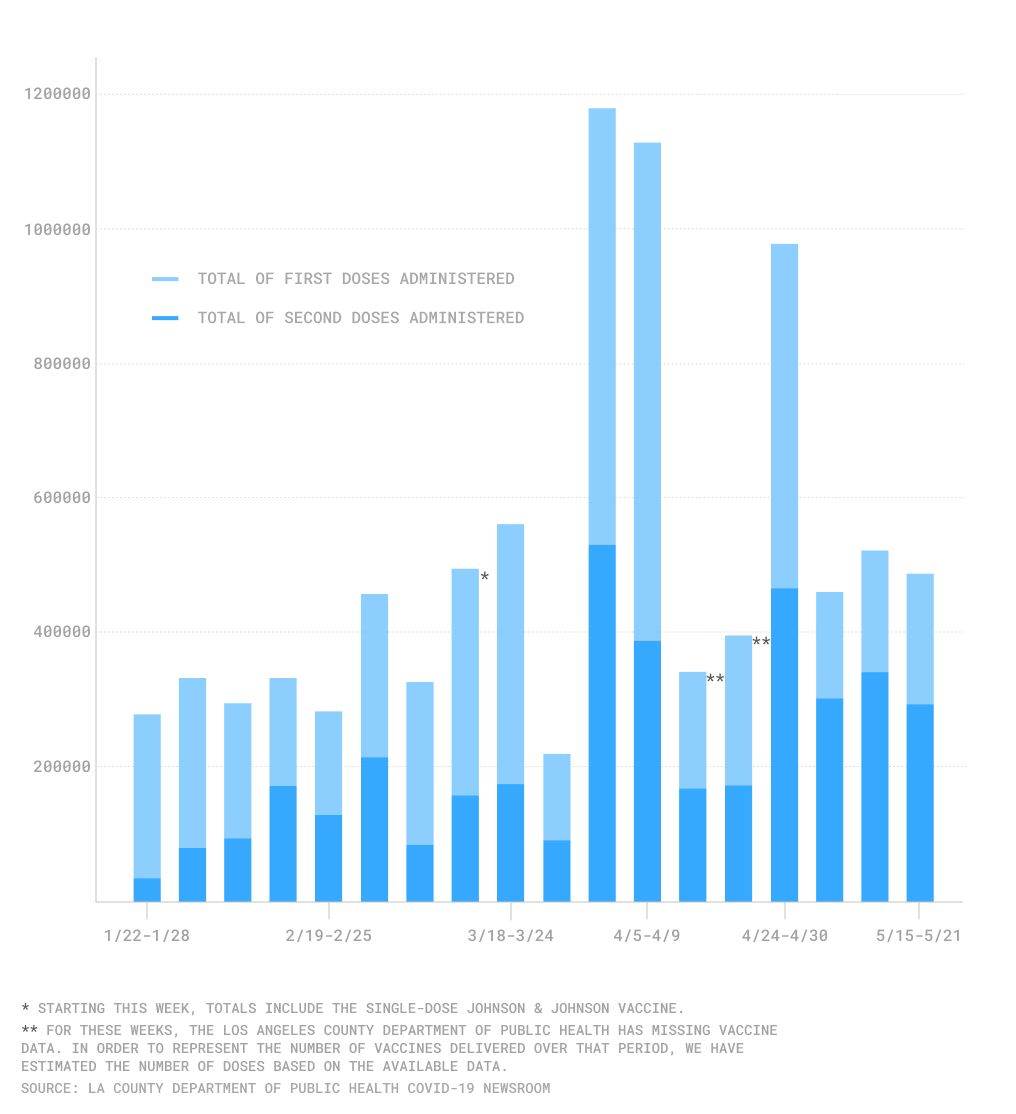
Vaccine doses administered in Los Angeles County by week
Vaccinations
Los Angeles County is creeping toward herd immunity (a figure that health officials place at somewhere around 80%, according to a May 10 press release). As of May 21, 50% of residents aged 16 and older and 72% of seniors aged 65 and older are considered fully vaccinated.
On May 24, the Los Angeles County Department of Public Health also reported that 28% of teens in the 16-17 age group and 46% of residents in the 16-64 age group are fully vaccinated. The county did not report percentages for residents aged 12-15, who are now eligible for the Pfizer vaccine.
There have now been 9,501,064 vaccine doses administered across the county so far, 3,980,667 of which have been second doses. Over the seven-day period May 15-21, 487,213 vaccines were administered, with 293,176 of them being second doses. These figures are a slight decrease from the previous period, when 521,041 total vaccines and 340,823 doses were administered from May 8-14.
The slowdown is likely a sign of waning demand among those who still have not had a shot. Many of those who have not been vaccinated are younger. That’s now evident among those winding up in the hospital. The Department of Public Health noted on May 24 that the largest proportion of COVID-19 related hospitalizations were people aged 30-49. Prior to April, older age groups consistently saw higher hospitalizations. But with so many in this age group vaccinated, their hospitalization numbers are dropping.
Cases and Deaths
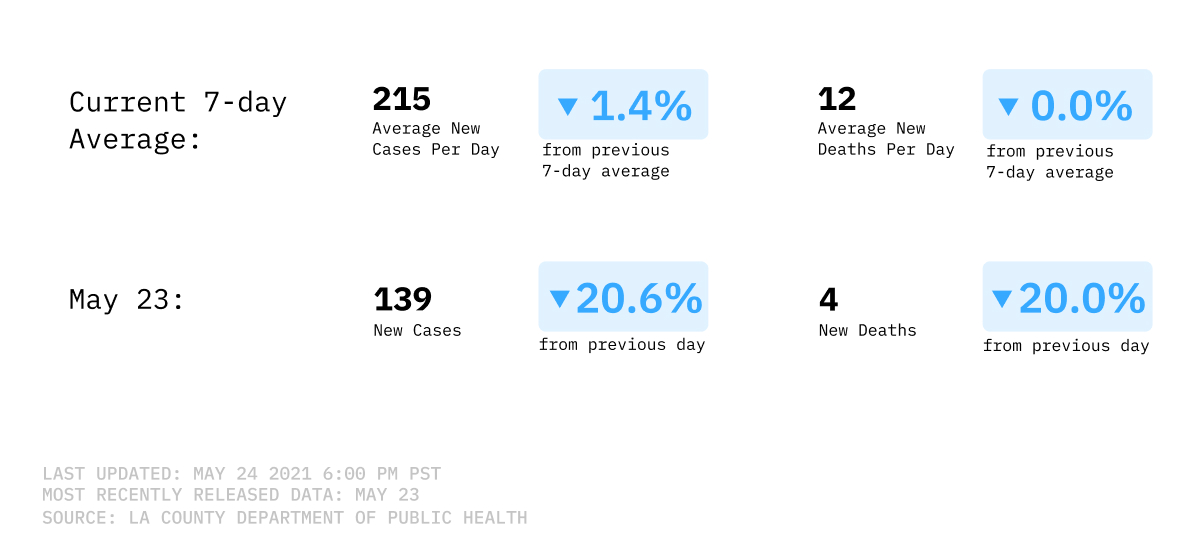
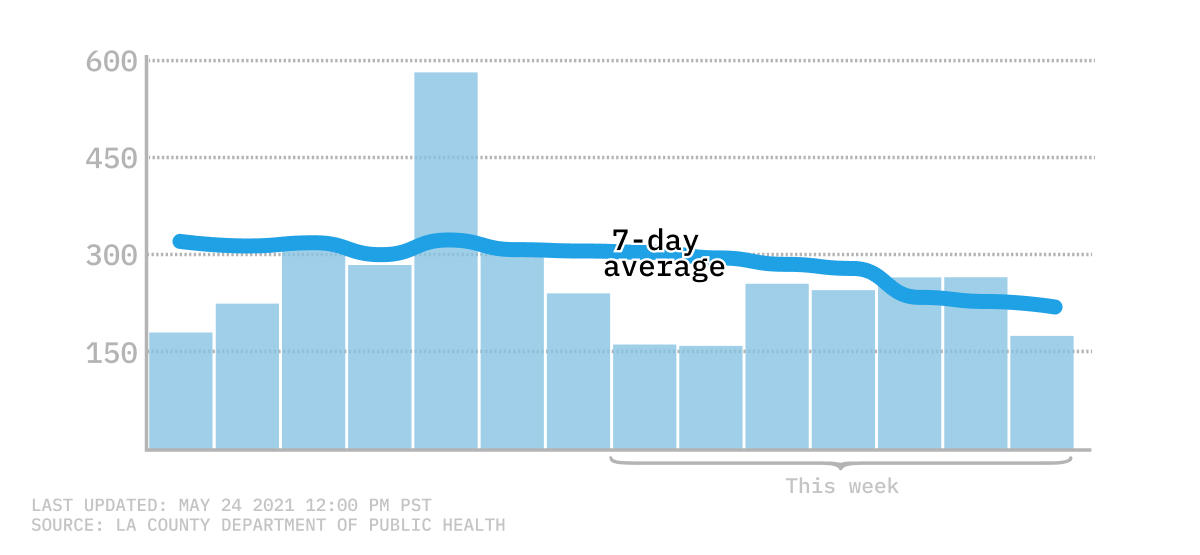
The rising vaccination rate is helping to drive down new cases. As of May 24, seven-day average COVID-19 infections have dropped to 215; the last time average cases were this low was March 28, 2020, at the very beginning of the pandemic.
While the number of daily cases continues to fluctuate, there is a clear downward trend. In the most recent week from May 16-22, no single day exceeded 300 cases. On May 24, the county reported 139 new cases. It’s likely that this figure is affected by weekend reporting delays, along with missing lab reports. Nonetheless, this is an improvement from the 8,243 cases reported four months ago on Jan. 24.
Seven-day average of new COVID-19 infections
The seven-day average for COVID-19 related deaths is dropping, but at a slower rate. As of May 24, the seven-day average was 12 deaths, a marginal decrease from the 14 average deaths reported a week prior. Still, this is a 90.1% decrease from the 121 average deaths reported on Feb. 24.
Just like new cases, daily death counts also bounce around. Most recently, the county reported 4 deaths on May 24, a 95.7% decrease from the nearly 100 deaths reported two months prior. Additionally, the seven-day period May 16-22 is the first week that figures have remained below 20 since Nov. 8-14.
Positivity Rate
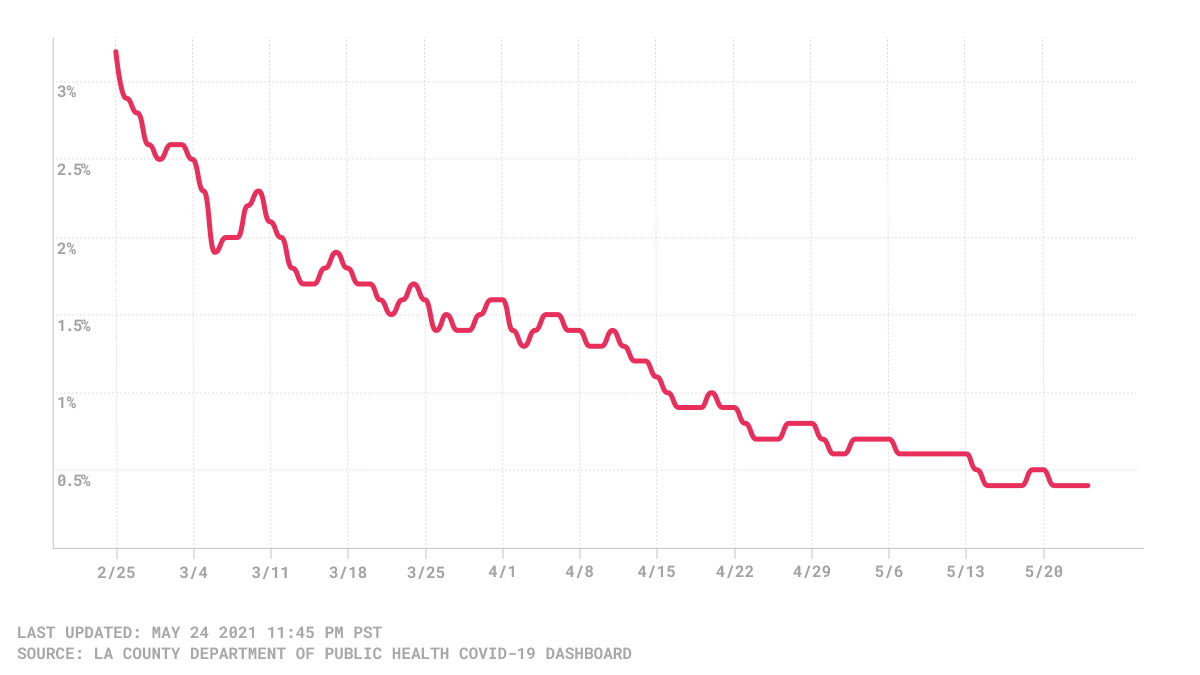
As of May 24, the daily test-positivity rate is still 0.4%, a figure that the county first reached on Friday, May 15. The last time the positivity rate was above 1% was April 15, well over a month ago. (The positivity rate is the percentage of COVID-19 tests that show a positive result for the virus.) At the beginning of January, this rate was above 20%.
Los Angeles County daily COVID-19 positivity rate
Hospitalizations
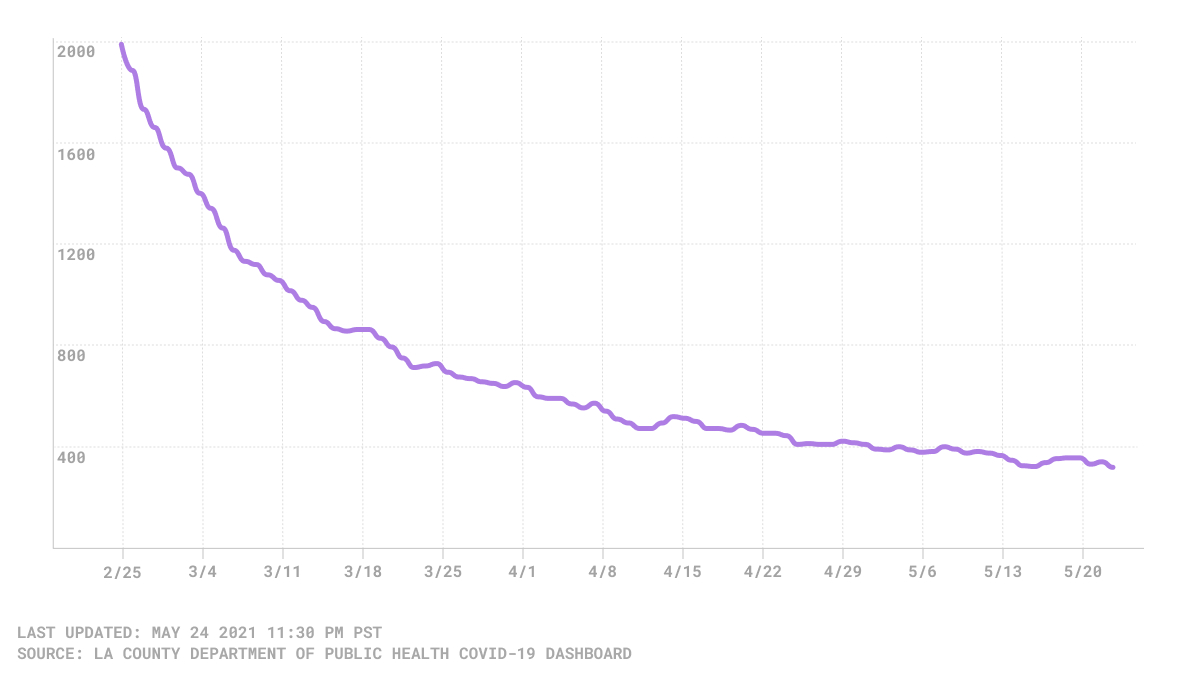
While other figures are on a promising trajectory, the number of COVID-19 hospitalizations are bouncing around in the 300s. Most recently, the county reported 319 hospitalizations on May 24, the lowest figure to date since the beginning of the pandemic. This is an 84.5% decrease from the 2,064 hospitalizations reported three months prior. The last time Los Angeles County reported over 400 hospitalizations was Sunday, May 2, over three weeks ago.
Three-day average of countywide COVID-19 hospitalizations
How We Did It: We analyzed coronavirus data related to new cases, deaths, hospitalization and vaccinations data provided by the Los Angeles County Department of Public Health.
Interested in our data? Check out the Crosstown coronavirus interactive map or email us at askus@xtown.la.


