A city-country divide—more than 70% of L.A. voters picked Kamala Harris

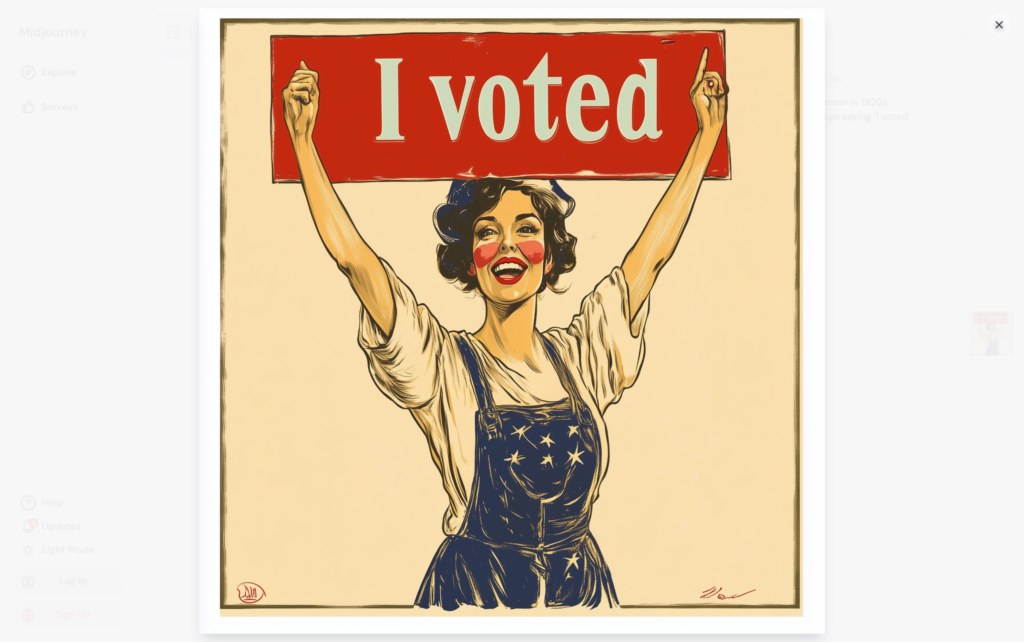
(Image generated with Midjourney)
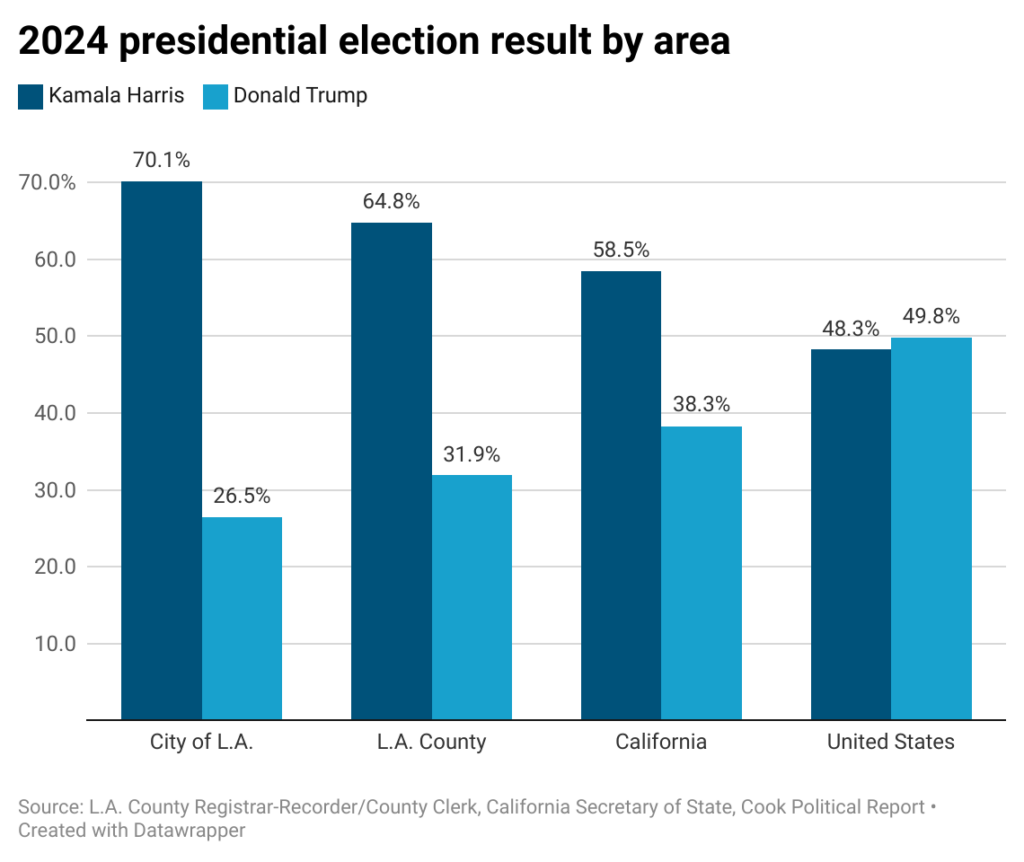
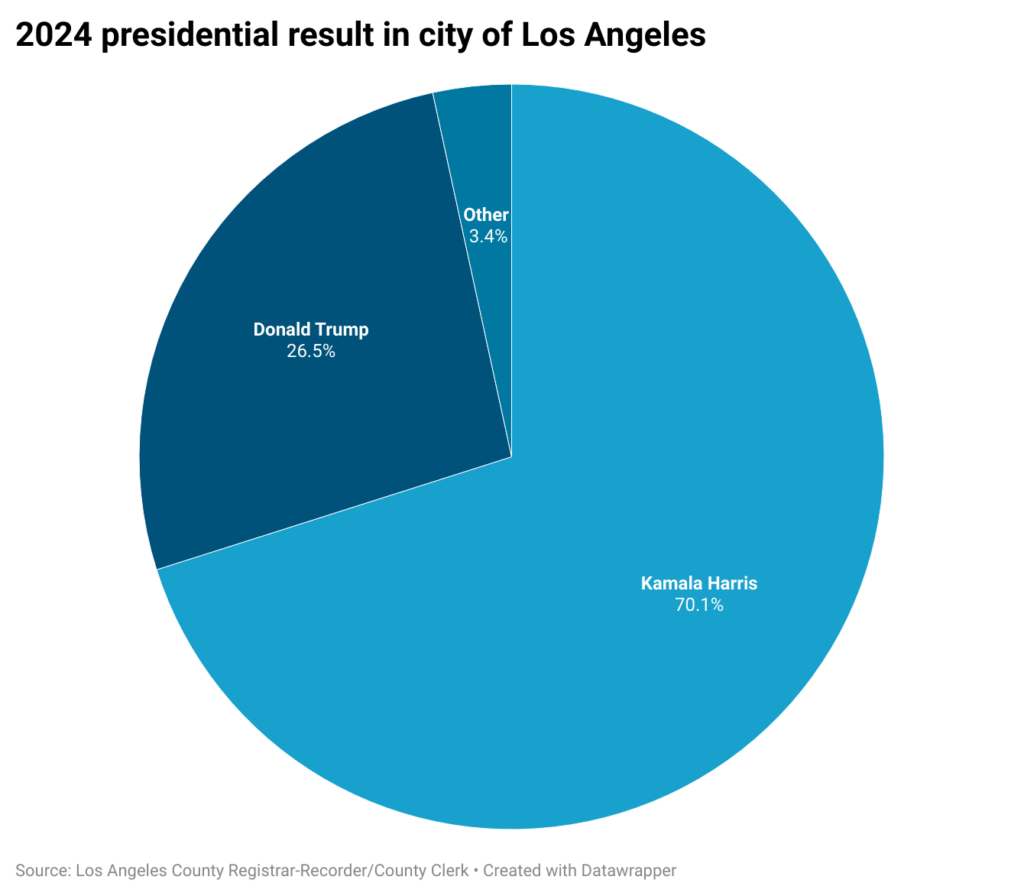
Los Angeles has a reputation for being extremely liberal. That was borne out in a plethora of results from the now-certified election, including the presidential contest: More than seven in 10 city residents voted for Kamala Harris, while 26.5% opted for Donald Trump.
The city outpaced the county and the state in its lean toward the Democratic candidate. Naturally, the biggest disparity is with the national result. President-elect Trump received 49.8% of the popular vote, eclipsing Harris’ 48.3%, according to the Cook Political Report. (Trump also received 312 electoral votes, to the 226 that went toward Harris.)

As Crosstown recently reported, about 66.1% of eligible L.A. County voters cast a ballot in the November election, producing the lowest turnout in decades, and about five percentage points below the statewide figure. Turnout in the city itself, with 2.16 million voters, was slightly lower, at 65.6%, according to data from the L.A. County Registrar-Recorder/County Clerk.
[Get crime, housing and other stats about where you live with the Crosstown Neighborhood Newsletter]
In the city, a total of 1,393,097 people voted for president, with nearly 977,000 ballots marked for Harris, and just under 370,000 for Trump.
Almost 47,000 votes went to another candidate, including 18,076 for the Green Party’s Jill Stein. Although Robert F. Kennedy Jr. had abandoned his campaign and endorsed Trump, 15,233 city residents still voted for him.

Interestingly, approximately 24,000 city residents filled out at least part of the ballot but did not vote for president.
Homelessness divide
Results further down the ballot also show the difference between Los Angeles residents and those outside city limits. That includes the results of county Measure A.
This was the proposal to replace a quarter-cent county sales tax that funds homeless services, which would sunset in 2027, with a half-cent tax that has no end date. It will provide about $1 billion a year to address the crisis.
County voters approved it with a solid 57.8%. But support in the city, where tent encampments seem to be in every neighborhood, was even stronger, with 64.5% saying yes.
L.A. Mayor Karen Bass had campaigned for Measure A. More than 820,000 city residents approved it.
Crime and the district attorney
Crime was a prominent issue in the election, and once again, results in the city of Los Angeles showed a leftward tilt. That includes the response to Proposition 36, the statewide initiative to increase penalties for certain drug and theft crimes.
It passed overwhelmingly, with more than 68% of Californians voting yes. In Los Angeles County the approval rate was 64%.
City of L.A. voters were more skeptical about a measure that critics contended would lead to more people being incarcerated. Angelenos still easily approved Prop 36, but by a 58.5%–41.5% margin.

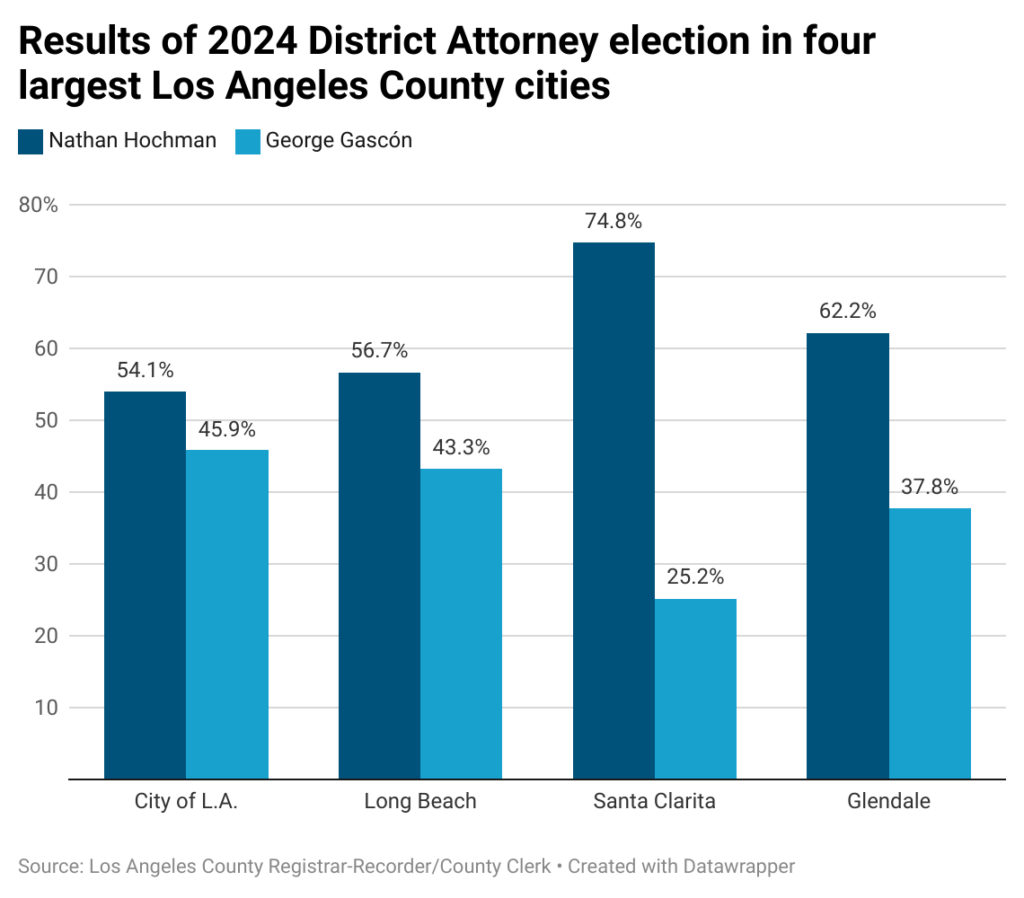
There was also a split in the election for District Attorney, where George Gascón was seeking a second term. The progressive, and deeply unpopular incumbent was defeated by Nathan Hochman, a former federal prosecutor. Hochman notched 59.9% of the vote.
City residents went for Hochman, but again, it was closer, approximately 54%–46%.
There were large discrepancies in some of L.A. County’s 88 cities. In Pasadena, Hochman received 50.4% of the approximately 58,700 votes.
Residents of Santa Clarita, the third-largest city in L.A. County, were far more eager to dump Gascón. Approximately 104,000 votes were cast in the city, with 74.8% going to Hochman.

How we did it: We analyzed Los Angeles County Registrar-Recorder/County Clerk data on overall votes cast and breakdowns by cities in L.A. County. We also examined results from the California Secretary of State.
Have questions about our data or want to know more? Write to us at askus@xtown.la.


