

How the pandemic changed your L.A. commute


Los Angeles roadways are 15% more congested now than before COVID.
Annie Phan knows this firsthand. She is out of her Santa Ana home by 6:20 a.m. to make it to work in Boyle Heights before 8. The journey, which traverses Route 22 to the 5 Freeway to the 710, then a maze of surface streets, is finely calibrated. Leave just a few minutes later and the commute can get 20 minutes longer.
“I kind of regret that I don’t commute on Mondays, because that’s when traffic is a little lighter,” she says.
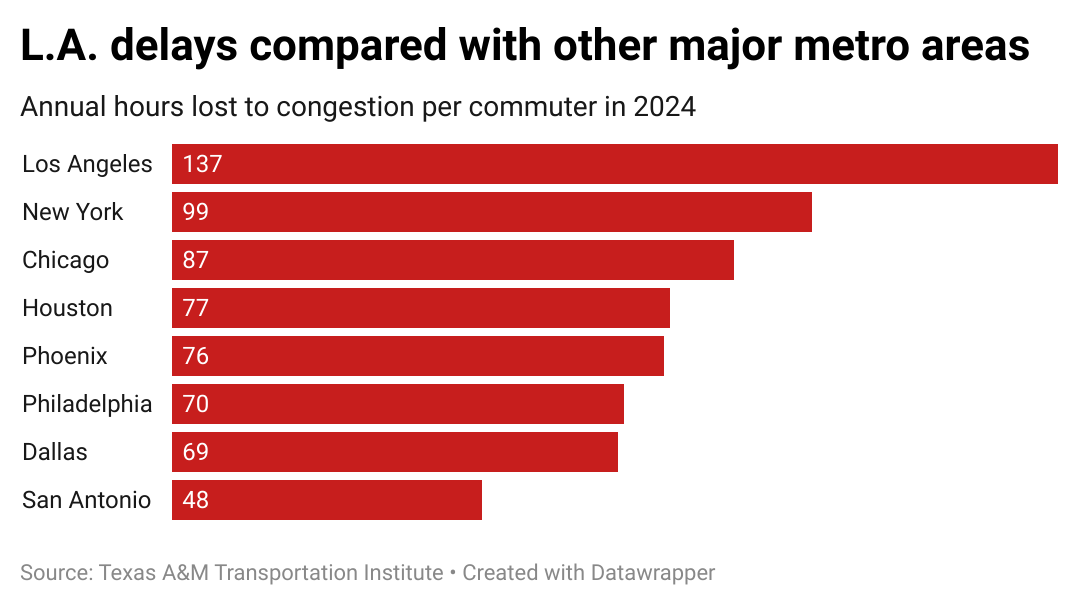
For decades, Los Angeles traffic has been a steady progression of worsening congestion. In 1982, the typical freeway commuter burned 61 hours a year in gridlock. Last year, the total had ballooned to 137 hours, or almost six full days lost to traffic.
Get data and news about your Los Angeles neighborhood with the Crosstown Neighborhood Newsletter
The new post-COVID normal
There is one bright spot, notes Kartik Jha, a research scientist at the Texas A&M Transportation Institute: “It could have been worse.”
That’s because the shifting work and commuting patterns that emerged during the pandemic have left a lasting impact on traffic. Flexible schedules and work-from-home options allow people to stagger commutes and change their driving habits. While the morning and evening rush hours still dominate, drivers have begun to spread the pain out across the day and even weekends.
“The middle of the day, weekends, and even late evenings are absorbing a lot of the travel that otherwise would have been packed into those rush hours,” says Jha. If our driving habits hadn’t shifted nationwide, he notes, U.S. commuters would have spent an additional 300 million hours in traffic last year.
But the change is not necessarily a plus for Phan. With traffic spread more evenly across the day, getting out of work sooner doesn’t mean a shorter commute. “Even if I leave early, I don’t really win,” she says.
Los Angeles tops the chart
The Transportation Institute’s study on congestion covers every major urban area in the U.S., dating back to 1982. Greater Los Angeles, which includes the Long Beach and Anaheim metro areas as well, ranks first in the nation in terms of congestion, a distinction it has held each of the past 43 years except for one: 2020. That year, when stay-at-home orders grounded many drivers, the New York metropolitan area took the top spot.
The worst hour of the week? Thursday between 4-5 p.m. During that time, 2.5% of all delays occur. The second worst? Wednesday between 4-5 p.m.
Los Angeles isn’t alone in California in dealing with mounting congestion. Greater San Francisco, which includes Oakland and communities in the East Bay, ranks just behind Los Angeles, with 134 lost hours per commuter. Those commutes are 30% longer than they were in 2019.
Longer commutes should mean more gallons of gas burned by congestion. That was the case in Los Angeles for decades. Gains in fuel efficiency were almost always outstripped by worsening traffic. But that script was flipped in 2022. Since then, the increased adoption of electric vehicles and other fuel-saving technology has meant that more hours in gridlock don’t necessarily translate to more gas wasted.
In 2024, the 137 hours lost in traffic translated to 33 excess gallons of gas burned. Just two years earlier, 122 hours of congestion resulted in 35 extra gallons.
What do worsening commute times mean for Phan? “I’m listening to a lot of music.”
How we did it: We analyzed more than 40 years of congestion patterns in Los Angeles and other metro areas, based on the Texas A&M Transportation Institute‘s mobility report.
Have questions about our data? Write to us at askus@xtown.la.


