Parking ticket? Average fines in L.A. neighborhoods can vary by more than $140



Get a parking ticket in Hancock Park and it will run you, on average, $197. In Sherman Oaks the average drops to $63.94. Leave your car in a disabled space without a valid placard and the fine is $1,100, no matter which neighborhood you are in.
It’s no secret that the cost of living in Los Angeles can swing wildly, from tony Brentwood to gritty San Pedro. But it also determines the average cost of your parking ticket. The citywide average for a citation is $89.74, yet some neighborhoods are nearly $100 above that.
Several factors are driving the discrepancy. Individual fines do not change by neighborhood, but the mix of violations does. Neighborhoods with a lot of high-dollar violations, like blocking a bus lane at $293 or parking in a disabled space at $363, or a commercial vehicle blocking a public street at $1,000, end up with higher average parking tickets. Areas with the lower averages generally have a lot of low-dollar fines, like an expired meter at $63 or blocking a driveway at $68.
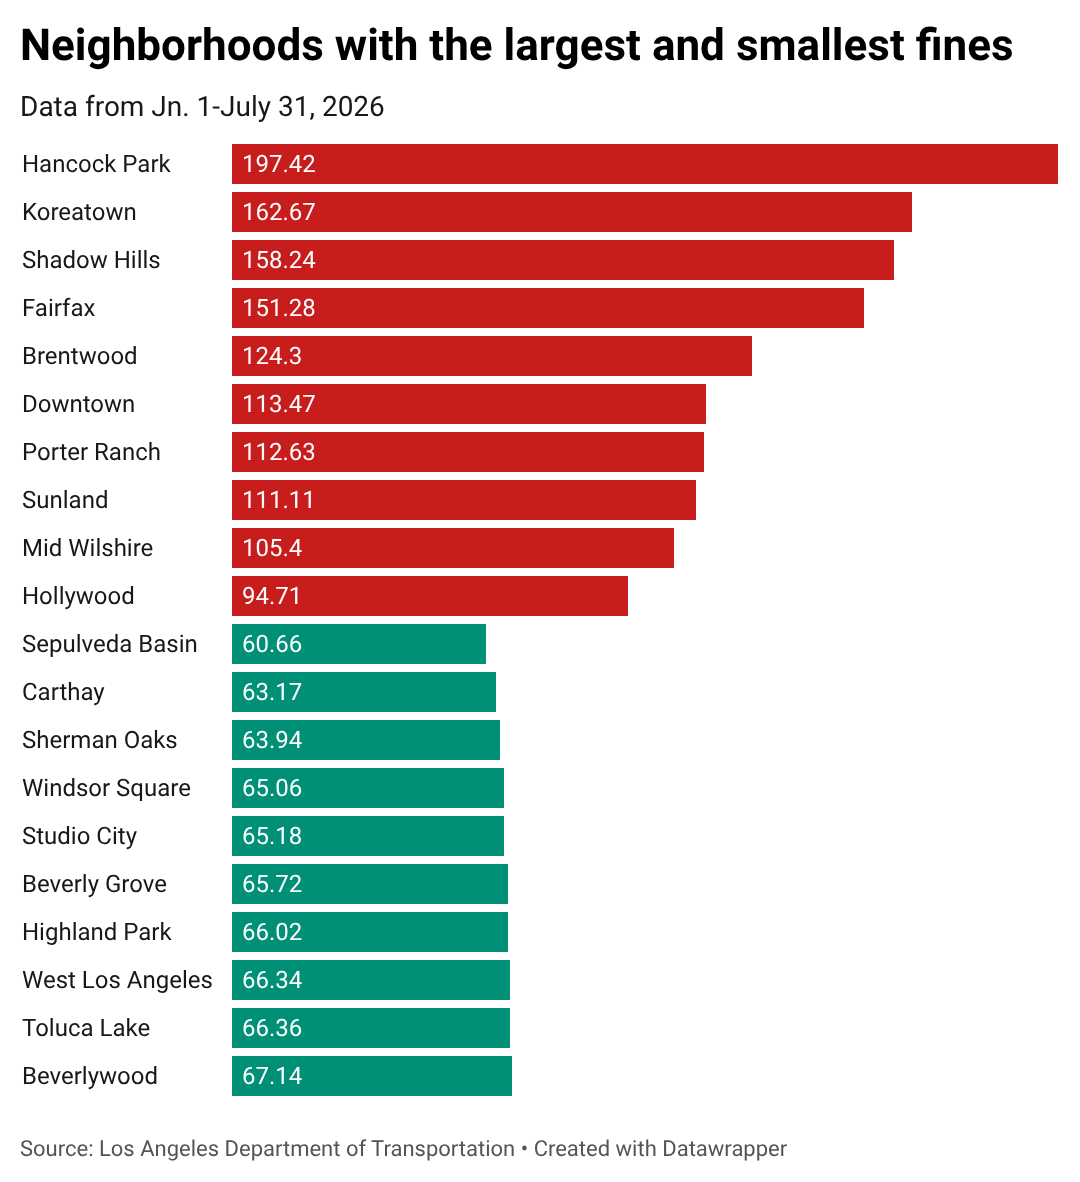
(Scroll down to see the average fine your neighborhood.)
How to park for $1,100
In 2019, the parking fine for misusing a disabled parking placard was $343. After the Department of Motor Vehicles documented more than a thousand cases of placard abuse, the City Council raised it to the state maximum in May 2019. The city’s Department of Transportation says the increase was meant to deter fraud and preserve access to spaces reserved for people with disabilities.
Parking fines were once a reliable source of funds for the city, generating tens of millions of dollars in surplus revenue. That changed in 2017, when the costs of running the parking enforcement program began to outstrip the money from fines. In fiscal year 2025 the gap swelled to more than $50 million.
Before 2016, the city routinely issued more than 2.3 million tickets a year. But that has fallen off as the parking enforcement division struggles to hire new officers and replace those who are retiring. It is hoping cameras can pick up where the officers have fallen off.
Last year, as Los Angeles was facing a budget deficit approaching $1 billion, the city Council began to look for any extra cash it could find. It raised the parking meter rate by 50% in October 2025 to $1.50 an hour, the first change in more than a decade. It also extended metered hours to midnight in the busiest areas.
Around the same time, LADOT delivered a study on whether the city was charging the right amounts. The study found that fines mostly matched the seriousness of the violation, but some could be adjusted to get more people to actually pay. LADOT recommended a mix of increases and decreases projected to bring in an additional $8 million over five years. (In the current fiscal year Los Angeles projects it will collect $125.6 million in parking fines.)
LADOT argued that lowering the fine for blocking a private driveway from $68 to $53 would actually encourage more people to pay, bringing in an additional $113,534 a year.
Smile, you got a ticket
The city is making a big bet that its rollout of cameras that automatically ticket offenders will bring in much more revenue. Cameras mounted behind the windshields of Metro buses have been recording lane blockers since February 2025, starting on the 720 line along Wilshire Blvd. and the 212 on La Brea Ave. The program has now been expanded to three more lines. In its first year the program issued 115,890 citations, according to reporting by StreetsBlogLA.
Before the cameras, officers were writing roughly 570 bus lane tickets a month. The cameras produce around 9,650. The program finished its first year with 115,890 citations and $19.6 million in assessed fines.
Big ticket neighborhoods
The priciest neighborhoods are not the ones with the most tickets. They are the ones where an expensive violation pulls up the average.
In Hancock Park, the most common ticket is $73 for an expired meter. That doesn’t explain the $182 average. The answer lies on Wilshire Blvd., which runs along the neighborhood’s southern edge. That’s where the 720 bus passes several times an hour, using its camera to automatically cite vehicles blocking the bus lane 29th with a $293 citation. So far in 2026, bus lane violations account for 6.5% of tickets issued citywide but more than $15 million in fines, over a fifth of all citation money.
Eagle Rock averages $63.22 not because enforcement is lighter there, but because there is no opportunity to commit the most expensive violations. That will eventually change. Metro broke ground in April 2026 on a rapid bus line that will run in dedicated lanes down the middle of Colorado Blvd., with construction reaching Eagle Rock this fall and service expected before the 2028 Olympics. Whether the cameras follow is a separate question. Metro plans to add enforcement systems to roughly 300 more buses, up from the 100 running now, and LADOT intends to put them on city DASH buses as well.
But the state law authorizing camera enforcement expires on Jan. 1, 2027. A bill to make it permanent, AB 1837, has cleared the Assembly and every Senate committee and is awaiting a floor vote.
How we did it: We examined more than a decade of parking citations and average fine amounts from the Department of Transportation, as well as Los Angeles city budgets.
Have questions about our data? Or want to ask us something? Write to us at askus@xtown.la
| Community | Average fine |
| Hancock Park | $197.42 |
| Koreatown | $162.67 |
| Shadow Hills | $158.24 |
| Fairfax | $151.28 |
| Inglewood | $137.33 |
| Brentwood | $124.30 |
| Downtown | $113.47 |
| Porter Ranch | $112.63 |
| Sunland | $111.11 |
| Mid Wilshire | $105.40 |
| Hollywood | $94.71 |
| Lake View Terrace | $93.64 |
| Westlake | $93.64 |
| Chatsworth | $90.11 |
| Sylmar | $89.96 |
| Tujunga | $88.72 |
| Westchester | $87.50 |
| Boyle Heights | $87.44 |
| Mission Hills | $87.37 |
| Sawtelle | $85.15 |
| Playa Vista | $84.39 |
| Panorama City | $83.88 |
| Northridge | $83.43 |
| Rancho Park | $81.90 |
| Wilmington | $80.44 |
| Florence Firestone | $80.27 |
| Historic South Central | $79.72 |
| Encino | $79.21 |
| Valley Glen | $78.55 |
| Harbor City | $78.51 |
| Gramercy Park | $78.45 |
| Griffith Park | $78.45 |
| Sun Valley | $78.09 |
| North Hills | $78.06 |
| Mid City | $77.45 |
| Chesterfield Square | $77.41 |
| Cypress Park | $76.91 |
| Lake Balboa | $76.88 |
| Arleta | $76.71 |
| Granada Hills | $76.62 |
| Vermont Slauson | $76.53 |
| West Hills | $76.43 |
| Pico Union | $76.34 |
| Pacoima | $76.30 |
| Beverly Crest | $76.11 |
| Playa Del Rey | $75.69 |
| Chinatown | $75.58 |
| San Pedro | $75.46 |
| Harvard Heights | $75.34 |
| Baldwin Hillscrenshaw | $75.29 |
| Exposition Park | $75.23 |
| Manchester Square | $75.22 |
| Woodland Hills | $75.13 |
| Winnetka | $75.01 |
| Canoga Park | $74.90 |
| Vermont Square | $74.65 |
| Vermont Knolls | $74.61 |
| Cheviot Hills | $74.61 |
| East Hollywood | $74.48 |
| Florence | $74.37 |
| Atwater Village | $74.19 |
| Elysian Park | $74.15 |
| Hansen Dam | $74.14 |
| University Park | $74.04 |
| Watts | $74.01 |
| Pacific Palisades | $73.70 |
| Central Alameda | $73.64 |
| South Park | $73.63 |
| Vermont Vista | $73.47 |
| Montecito Heights | $73.36 |
| Arlington Heights | $73.21 |
| Hyde Park | $73.20 |
| Adams Normandie | $72.95 |
| Westwood | $72.91 |
| Green Meadows | $72.82 |
| Mount Washington | $72.79 |
| Reseda | $72.76 |
| Harbor Gateway | $72.69 |
| Jefferson Park | $72.60 |
| Hollywood Hills | $72.59 |
| West Adams | $72.28 |
| Leimert Park | $72.19 |
| Lincoln Heights | $72.14 |
| Mar Vista | $72.09 |
| Van Nuys | $71.94 |
| Glassell Park | $71.89 |
| Venice | $71.78 |
| North Hollywood | $71.71 |
| Broadway Manchester | $71.62 |
| Del Rey | $71.56 |
| Los Feliz | $71.20 |
| El Sereno | $71.09 |
| Echo Park | $70.75 |
| Elysian Valley | $70.70 |
| Palms | $70.01 |
| Larchmont | $69.90 |
| Silver Lake | $69.81 |
| Bel Air | $69.74 |
| Pico Robertson | $69.66 |
| Tarzana | $69.63 |
| Hollywood Hills West | $69.46 |
| Valley Village | $68.56 |
| Eagle Rock | $68.18 |
| Century City | $67.80 |
| Beverlywood | $67.14 |
| Toluca Lake | $66.36 |
| West Los Angeles | $66.34 |
| Highland Park | $66.02 |
| Beverly Grove | $65.72 |
| Studio City | $65.18 |
| Windsor Square | $65.06 |
| Sherman Oaks | $63.94 |
| Carthay | $63.17 |
| Sepulveda Basin | $60.66 |