

As LA Temperatures Rise, Crime Falls


It’s been a scorcher this summer for LA, with some of the hottest July temperatures ever recorded. And while the thermometer rose, crime in the city last month actually showed a decline. Here’s some July crime data for Los Angeles.
First off, July had the lowest average number of crime reports per day for any month in 2018. This comes after the year-high in May:
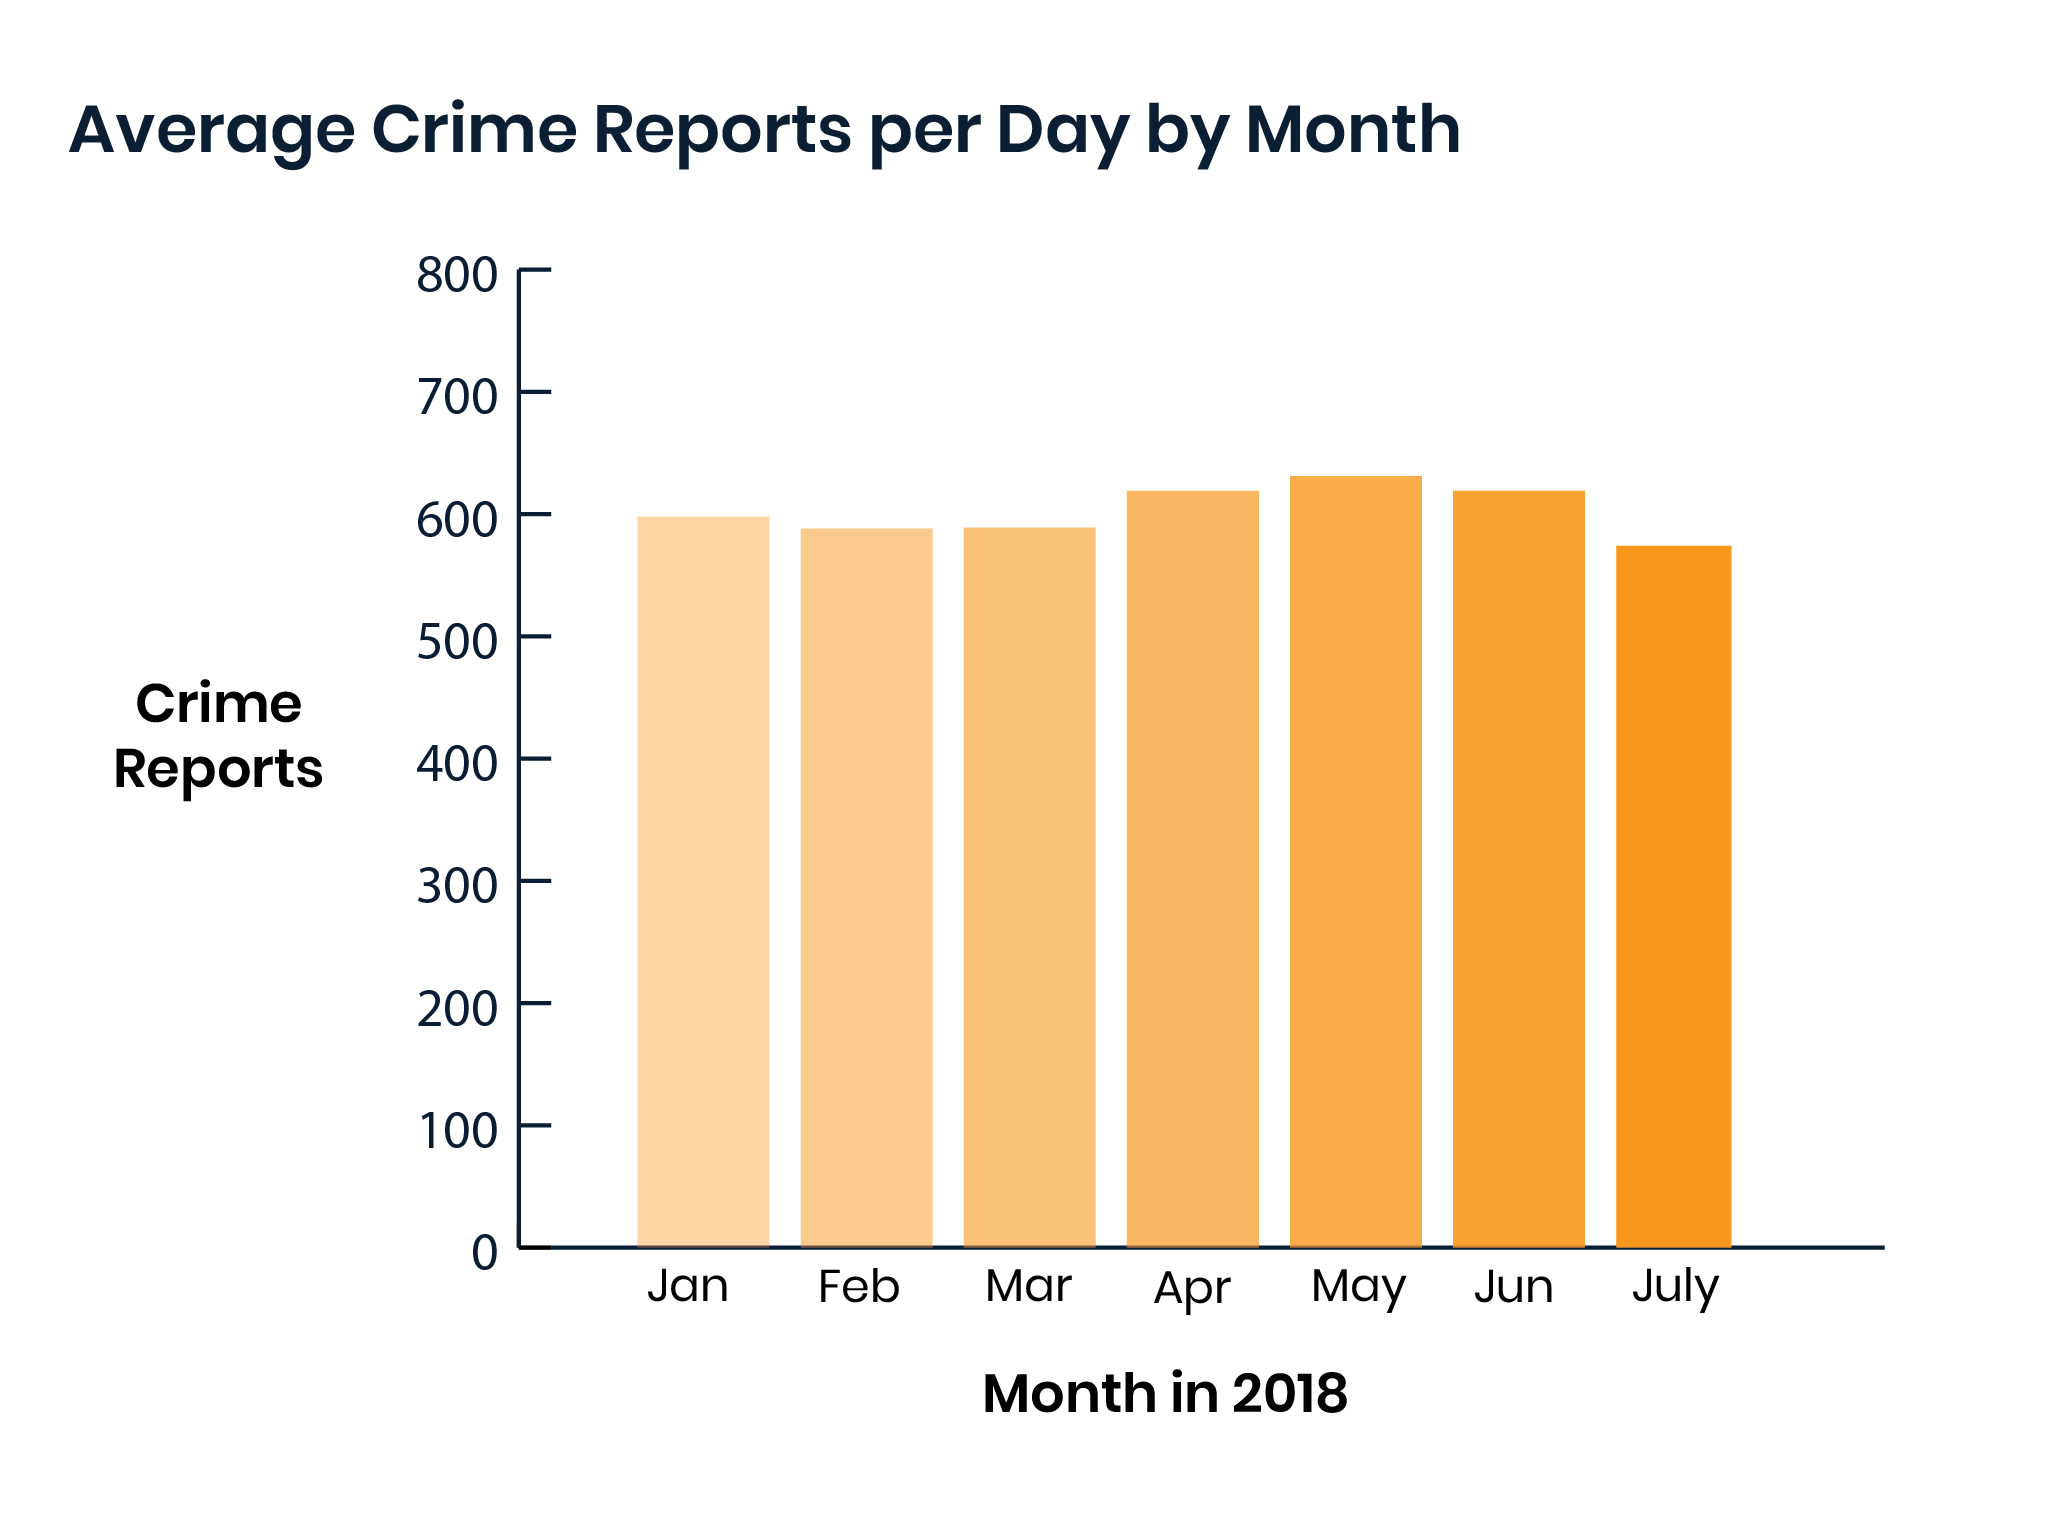
(We took the total number of crime reports in each month, and divided by the number of days for that month.)
In fact, July also had the lowest number of average daily crime reports for the last two years.
When we compare the total number of crime reports filed in July with other months, we see a consistent decline.
Total number of LAPD crime reports
- June 2018 to July 2018:
- 18575 –> 17815 (-4%)
- January 2018 to July 2018
- 18566 –> 17815 (-4%)
- July 2017 to July 2018
- 19485 –> 17815 (-9%)
In 2017, crime reports jumped 7% between June and July. But this year, the number dropped 4% between those months.
Here are the Top 5 neighborhoods in LA with the most crime reports:
- Downtown: 1141
- Hollywood: 647
- Westlake: 537
- Van Nuys: 515
- Boyle Heights: 474
No surprises here, given how densely populated these areas are.
These are the neighborhoods where we saw the most significant increases in crime reports:
- Manchester Square:
- 50 –> 77 (+54%)
- Harvard Park:
- 71 –> 100 (+41%)
- Northridge:
- 216 –> 282 (31%)
- Mid City:
- 202 –> 261 (29%)
- Vermont Square:
- 268 –> 325 (21%)
There were also some significant decreases in neighborhood crime reports:
- Watts:
- 280 –> 195 (-30%)
- Palms:
- 131 –> 97 (-26%)
- Fairfax:
- 201 –> 151 (-25%)
- Los Feliz:
- 147 –> 118 (-20%)
- San Pedro:
- 327 –> 265 (-19%)
To adjust for the size and population of a certain area, we also calculated the neighborhoods with the highest crime rates:

(The “crime rate” statistic is found by dividing the number of crimes in that month by the population of a particular neighborhood, then multiplying it by 100,000. This stat represents how many crimes occurred in July per 100,000 people.)
Lastly, here’s a list of the 5 most commonly reported crimes in July:

We collect and sort the data produced by the Los Angeles Police Department. Find more details about our data here.
Check out our last crime data story (featured in Tuesday’s LA Times newsletter!) here.
Still have questions? Write to us at askus@xtown.la


