

Who Are the Victims of Hate Crimes in LA?


After years of steady rise, the number of hate crimes in the City of Los Angeles fell during the first half of 2018 compared with the same period a year earlier.
This report is part of a series on the victims of crime in L.A. See our recent analysis on the victims of gun crimes.
The lowest year for total number of hate crimes in recent history was 2013, with 114, according to data compiled in a recent report on hate crime by Profs. Brian Levin, Kevin Grisham and John Reitzel of California State University, San Bernardino. Since then, the number of reported incidents has steadily increased, with a peak of 284 crimes in 2017.

However, between January and June, there were a total of 124 hate crimes reported to the Los Angeles Police Department, down from 134 during the same period in 2017.
The Federal Bureau of Investigation defines hate crimes as offenses that are, “Motivated by biases based on race, gender, gender identity, religion, disability, sexual orientation, and ethnicity.” We find hate crimes in our data by the identifying Los Angeles Police Department reports that include crime code 0903, which classifies a crime as “motivated by hatred or prejudice.” Non-criminal acts that involve bigotry are recorded by the LAPD as “hate incidents,” but are not included in the numbers in this report. Examples of these incidents are derogatory language or bigoted graffiti.
Below is a breakdown of groups targeted based on data provided in the LAPD crime reports for the first six months of 2018:
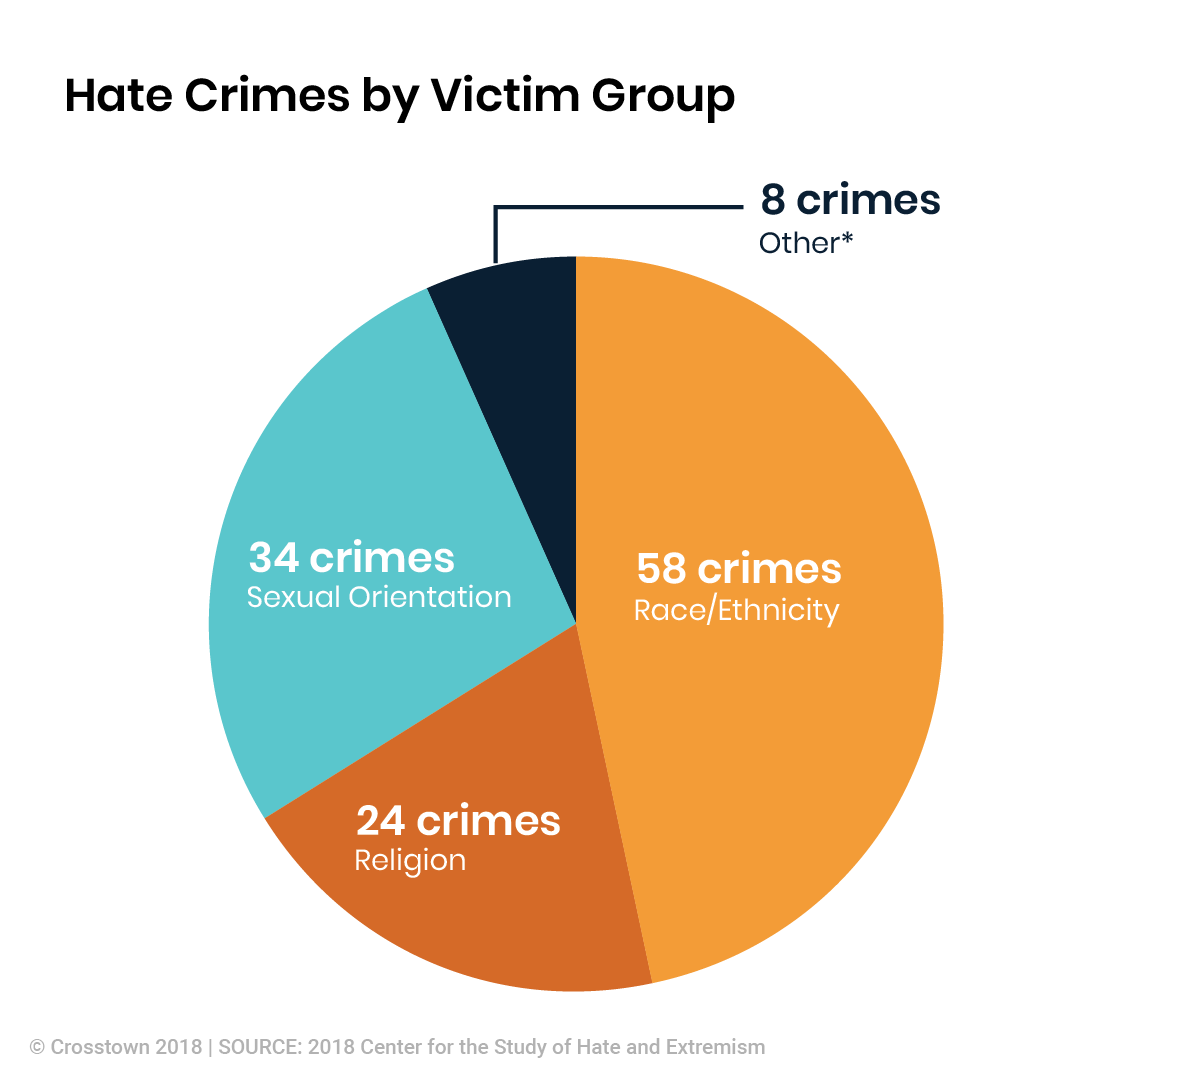
*Represents Physical/Mental Disability and Gender hate crimes
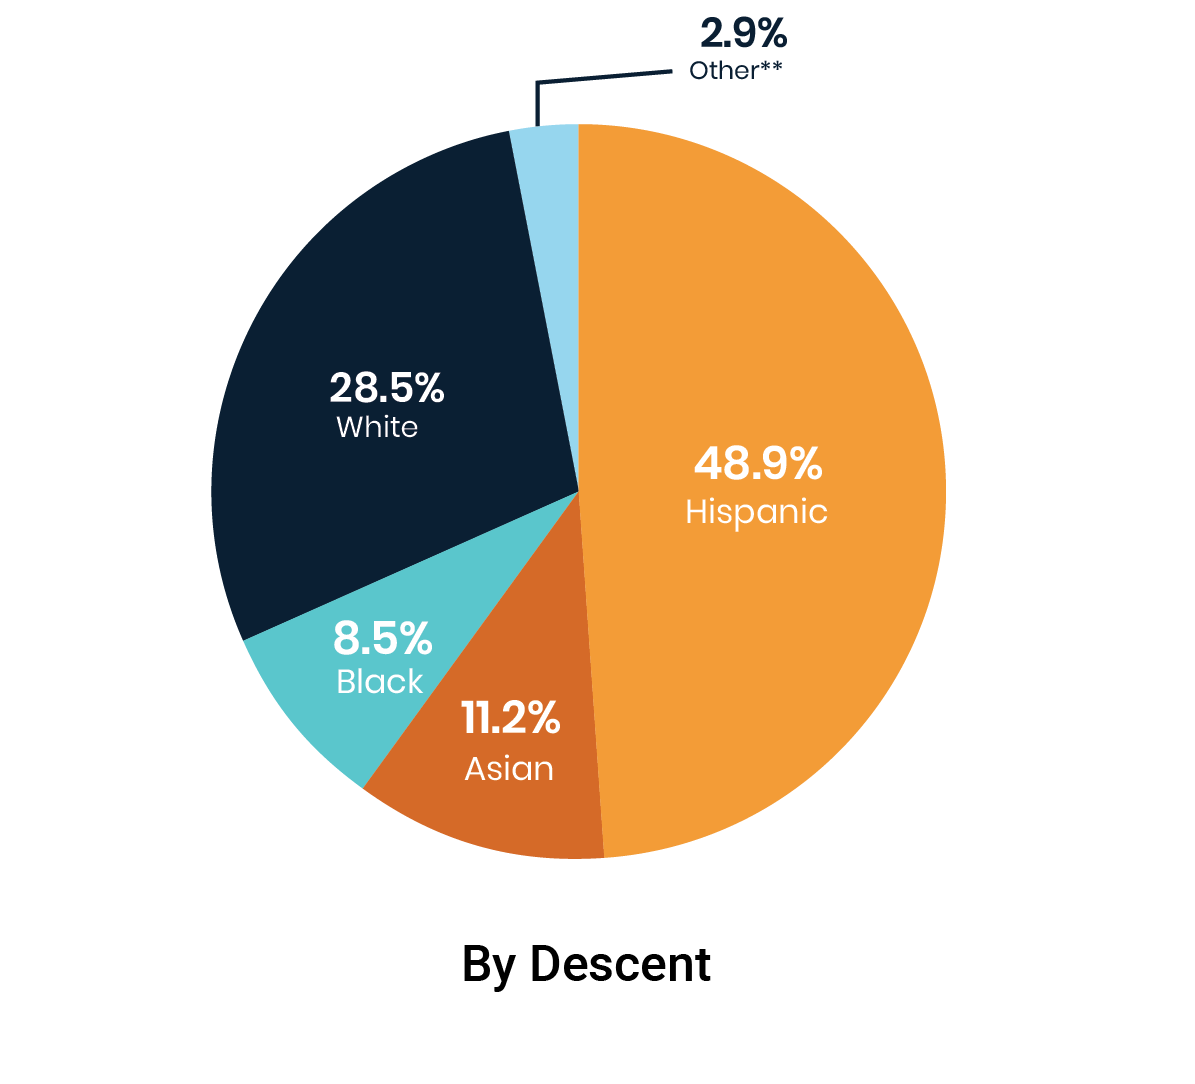
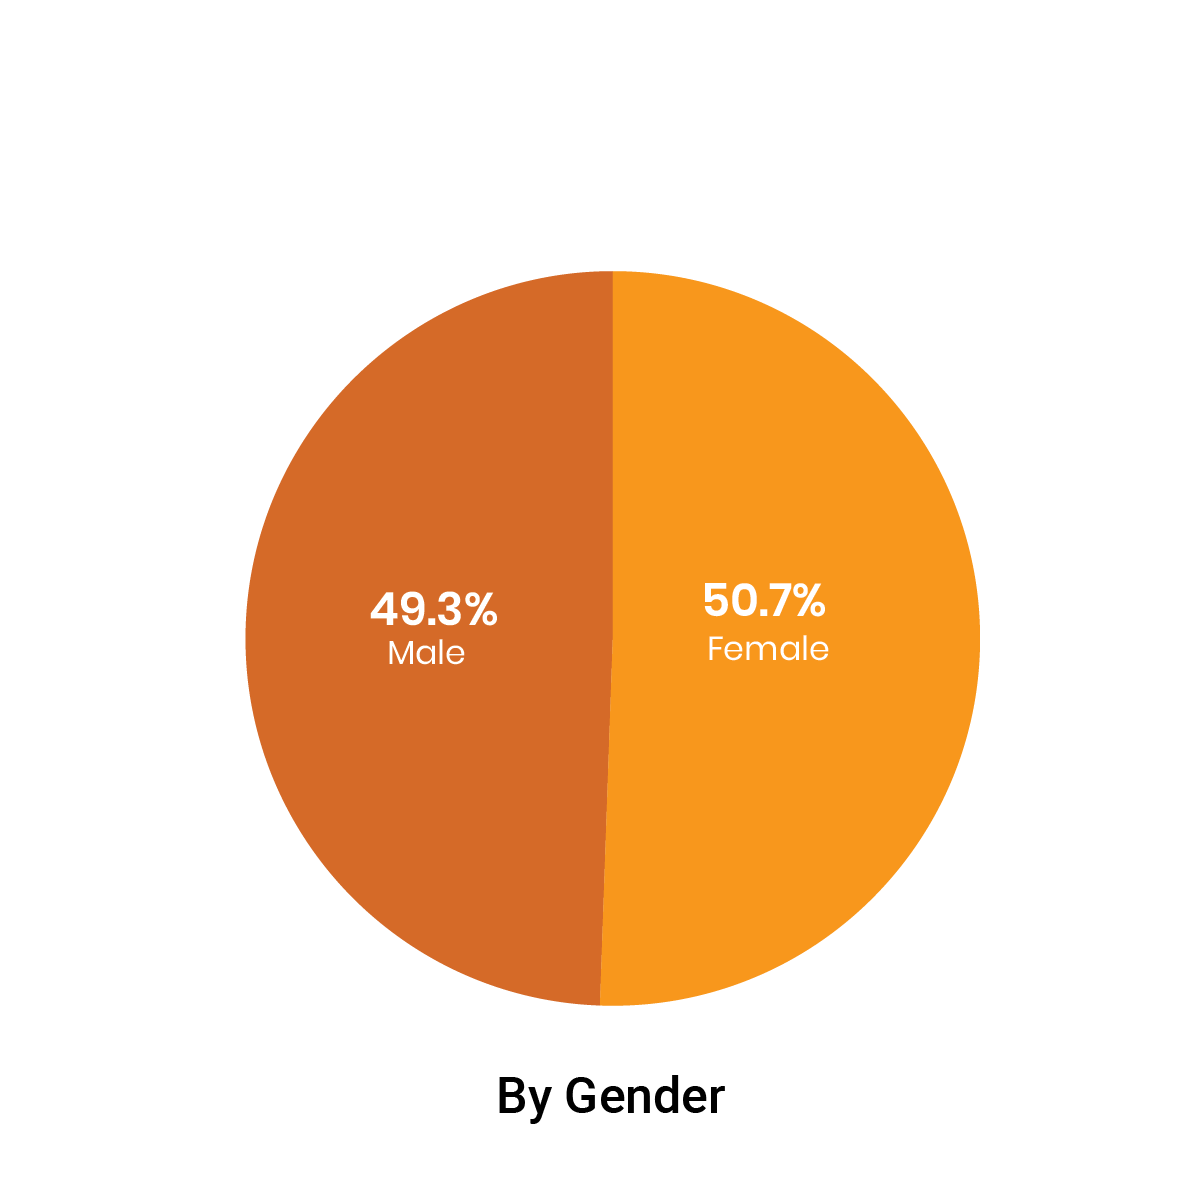
And here are the demographics for Los Angeles as a whole, based on the U.S. Census Bureau’s 2016 American Community Survey:
Hate crimes represent only a tiny fraction of the 110,292 crimes reported to the LAPD in the first half of the year. New York City, which has a population of more than twice that of Los Angeles, recorded 164 hate crimes during the first six months of 2018, according to the CSUSB report. However, from 2017 to 2018, New York saw a 17% decrease in all hate crimes, while L.A. had about an 8% decrease.
“This year, Los Angeles, and other major US cities saw a decline in hate crimes–likely because there weren’t many catalytic events,” Prof. Levin said, adding, “But L.A. saw less decline than the other cities and more violent hate crime than last year.”
Prof. Levin emphasized that despite the overall decline in the first six months of 2018, “The unstable sociopolitical climate makes it impossible to predict.”
According to the LAPD, hate crimes are often logged while investigations are ongoing, and facts surrounding an investigation can change. Our data closely reflects the official LAPD statistics, but is a more up to date version of the logged crime numbers.
**LAPD data offers more detail than shown in the charts. Officers can describe a victim using any of 11 categories of Asian descent (Chinese, Cambodian, Filipino, Japanese, Korean, Laotian, Pacific Islander, Samoan, Vietnamese, Asian Indian, and Other Asian). We merge those categories into Asian because LAPD almost never uses most of them. The Other Asian category is by far the most commonly used on crime reports.


