What’s the Connection Between Heat and Crime in LA?
Sociologists and criminologists have long debated whether rising temperatures correlate with an increase in crime. We noted in a recent piece that this past July crime actually dipped as Los Angeles sweltered through a brutal heat wave.
This prompted us to take a closer look into how temperature might impact crime, considering LA’s consistently sunny weather.
One of the best known studies on this theory looked at violent crimes in Minnesota over a two year period. The study by psychologists Ellen Cohn and James Rotton at Florida State University reported that crime and heat tend to increase with one another. At around 80 degrees, however, the correlation begins to fray. They found that crime actually began to decrease when temperatures rose over the 80-degree mark, indicating that people might become less violent when it becomes too hot out.
Others say the real relationship is between the climate of a general area and it’s respective crime rate, not the day-to-day temperature. Research by Paul A. M. Van Langue at Vrije Universiteit in Amsterdam says that countries closer to the equator are more violent. Meanwhile, places with colder averages, like Amsterdam or Norway, show less nationwide aggression.
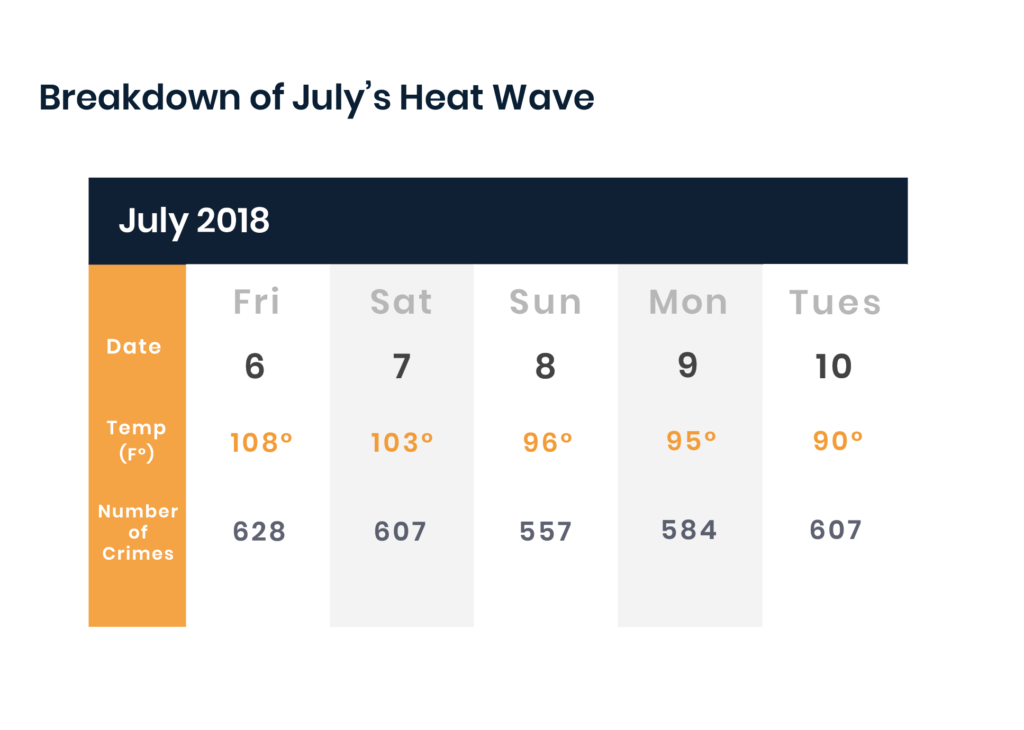
So what happened in LA when thermometers hit 108 degrees or more in July? Apparently nothing too different:

The number of crime reports didn’t change much over this five day period. For a majority of the days, in fact, reports were below July’s average of 617 per day.
In LA, however – where we enjoy consistent sunny skies – weather fluctuates significantly less than in most areas.
“Weather probably doesn’t have much of an impact in LA,” New Orleans-based crime data analyst Jeff Asher says. “It doesn’t get cold out there.”
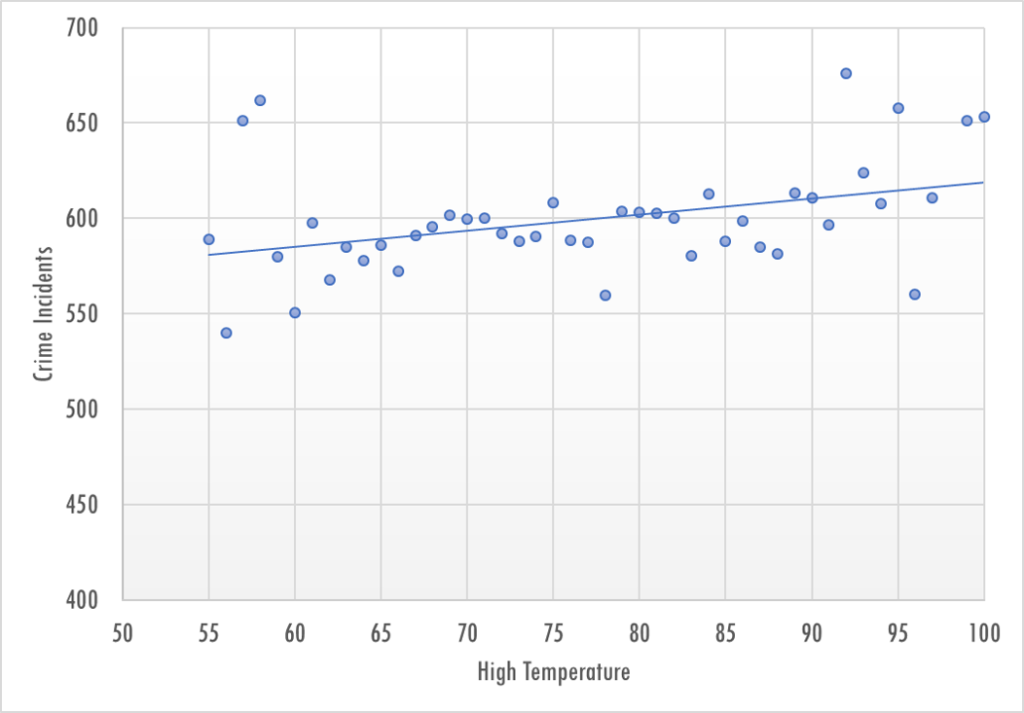
Asher explains that the impact of heat on crime rates in the city from 2014 to 2018 is a slight one:
CRIME INCIDENTS AND HIGH TEMPERATURES IN LOS ANGELES 2014-2018

This is Asher’s log of the average crime incidents in relationship to the average high temperature per day, using data from the National Oceanic and and Atmospheric Administration.
“The weather has an impact, but not a ton,” he says.
LA’s warm climate is one prominent reason why relationship between heat and crime is questionable. Even in other places, however, there is still more to be analyzed when it comes to specific reports.
“It probably depends on the crime,” Asher said. “With gun violence, I’d say it’s more like there’s a relationship between cold and shootings,” he says, “So places where it gets cold don’t see much impact.”
A look at Los Angeles in 2018 shows that there is no distinct correlation between the hottest day of the month and the day with the most reported crimes. Similarly, the day with the least reported crimes of each month didn’t correlate with any unusual dips in temperature.
We found this data by using reports from the Los Angeles Police Department. Our weather reports from each day comes from weather.com.
For each day in 2018, up to last July, we found the average temperature and the number of crimes reported in Los Angeles for each day. We then found what the hottest and coldest days were, along with what days reported the highest and lowest crime report counts.
Here’s a breakdown of what we discovered:
| Average Temp (F) | Average Crime Count | |
|---|---|---|
| January | 73 | 609 |
| February | 70 | 609 |
| March | 68 | 609 |
| April | 74 | 631 |
| May | 73 | 657 |
| June | 78 | 628 |
| July | 87 | 617 |
| Highest Crime Report Count in One Day | Temperature of Day (F) | |
|---|---|---|
| January | 836 | 72 |
| February | 786 | 79 |
| March | 688 | 63 |
| April | 726 | 69 |
| May | 731 | 61 |
| June | 738 | 74 |
| July | 685 | 85 |
2018 – Crime Report Lows and Temperatures*
| Lowest Crime Report Count in One Day | Temperature of Day (F) | |
|---|---|---|
| January | 523 | 78 |
| February | 533 | 70 |
| March | 536 | 58 |
| April | 575 | 69 |
| May | 561 | 76 |
| June | 568 | 74 |
| July | 548 | 89 |
Overall, there doesn’t seem to be any obvious connection between heat and the rate of crime reports on a given day in 2018. This could be because of a disparity in which the LAPD logs its crimes – a majority of reports seem to come in at the beginning of the month. In six out of the first seven months of 2018, the days with the highest number of crime reports were the first of the month.
But for Los Angeles, any suspicion that crime rates or violence is affected by rising temperatures could just be speculation. Crime, it turns out, might be as consistent as the weather.


