

Car break-ins dip in early 2019


Illustration by icons8
Reports of people stealing stuff from cars – the most common crime in Los Angeles in 2018 – dropped in the first quarter this year compared with the same period a year ago.
There were 7,624 reports of thefts from vehicles from Jan. 1 – March 31, 2019 in the City of Los Angeles. During the same time period in 2018, there were 8,088 reports, a decrease of 5.7%.
Despite the slight decrease in total break-ins in LA this quarter, Beverly Grove resident Danielle Peters has seen the opposite. So far this year, her family’s Jeep has been broken into twice while parked outside her home, most recently about a month ago. In 2018, it was broken into three times.
Peters galvanized 100 of her neighbors to hire a private, armed security to patrol the neighborhood at night. They have also individually installed lights and security cameras. But their efforts have had limited success.
“At this point, we just leave the car empty and unlocked because it’s cheaper than fixing smashed windows,” Peters said.
Peters, who has lived in the Beverly Grove area her entire life, said that in the past five years she seen more vehicle break-ins in the neighborhood than ever. Police have been responsive to calls about the thefts, she said, but can’t always investigate non-violent crimes.
“It’s just a shame because the Wilshire police division of the LAPD are stretched so thin that these incidents really can’t be a priority.”
While the first quarter numbers are down, total number of reported thefts from vehicles have increased every year for the past six years in LA.
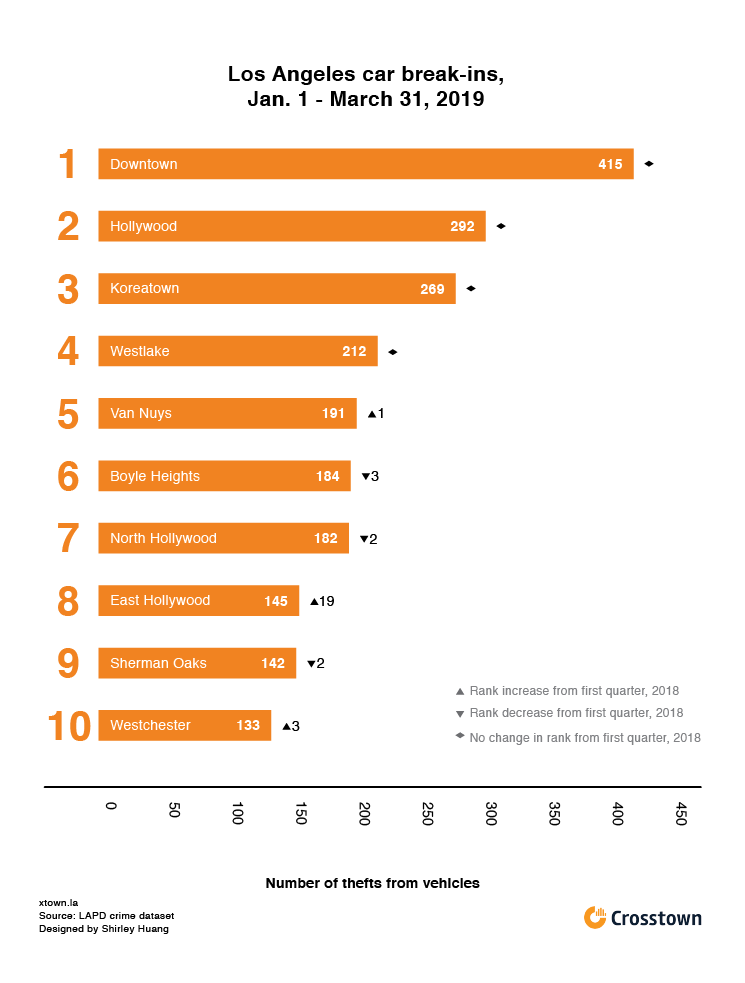
The neighborhoods of Downtown, Hollywood and Koreatown tend to have the most car break-ins in a given year. That’s also true for the first quarter of 2019. East Hollywood ranked 8th most break ins, an increase of 19 places from its 2018 first quarter ranking.
How we did it: We examined publicly available LAPD data on thefts from vehicles. For neighborhood boundaries, we rely on the borders defined by the Los Angeles Times. Learn more about our data here.
LAPD data only reflects crimes that are reported to the department, not how many crimes actually occurred. In making our calculations, we rely on the data the LAPD makes publicly available. LAPD may update past crime reports with new information, or recategorize past reports. Those revised reports do not always automatically become part of the public database.
Want to know how your neighborhood fares? Or simply just interested in our data? Email us at askus@xtown.la.


