Stolen cars down so far this year
Three-thousand, nine-hundred and ninety-eight may seem like a lot of cars stolen in the City of Los Angeles from Jan. 1 – March 31, 2019. But that’s down 5.7% from the same period last year, which had 4,404 reports.
The year-end total for 2018 was 17,346, a 9.3% decrease from the record-setting 19,130 cars stolen in 2017, according to the publicly available LAPD data.
Hemanth Gowda’s car was one of those.
At the time, he was dating a USC student and had parked his black 1999 Honda Civic on Adams Blvd. and Hoover St. in University Park one evening while he was also in the process of moving out of his apartment. He discovered the next morning that the car had disappeared.
Gowda reported the incident to the local LAPD, who recovered the vehicle about a month later in Florence. That year, 2017, the LAPD recovered over 90% of stolen vehicles.
The three most popular cars to steal that year were 1998 Honda Civics, 2000 Honda Civics and 1997 Honda Accords, according to a California Highway Patrol report.
For Gowda, none of the items inside the car were recovered.
“The most precious thing I lost was all my undergrad documents and every other legal document I had was in a folder in the car,” he said.
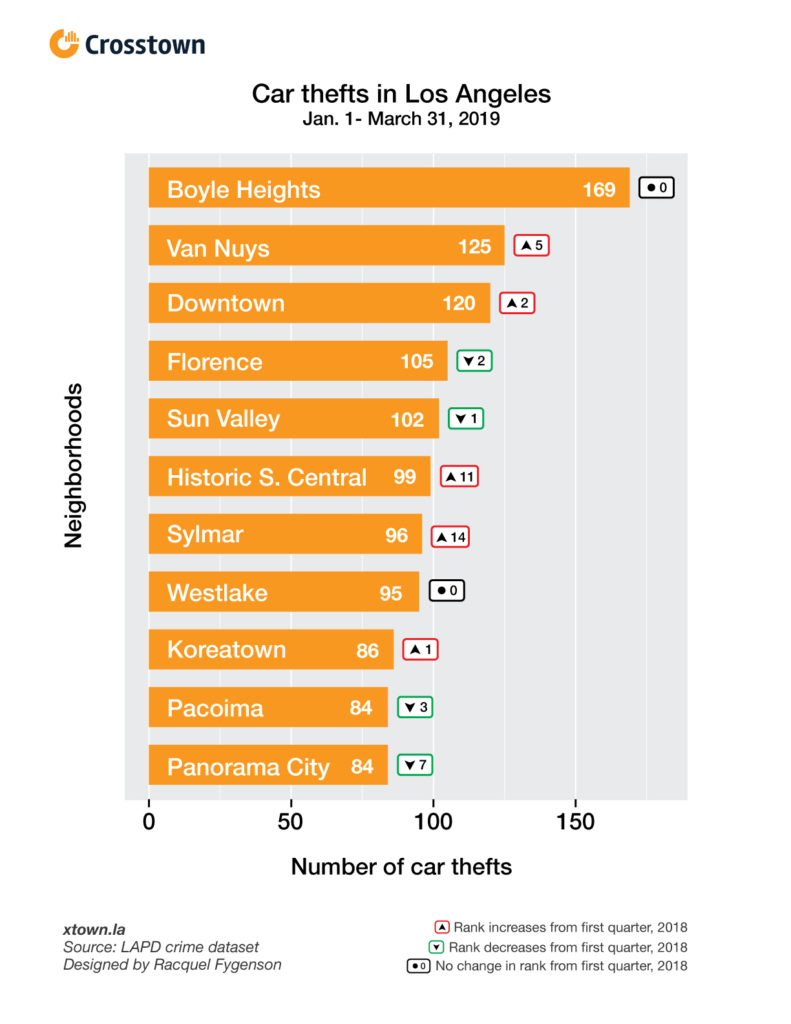
As for this year, the top three neighborhoods for car theft during the first quarter were Boyle Heights, Van Nuys and Downtown. Panorama City and Florence both dropped from the top three spots during the first quarter last year to places #4 and #10 for this year’s first quarter.
Historic South Central and Sylmar joined this year’s first quarter ranking up 11 and 14 spots from last year, with 99 and 96 thefts, respectively.
Below are the totals and rankings of the top ten neighborhoods for stolen cars from Jan. 1 – March 31, 2019.

How we did it: We examined LAPD publicly available data on reports of vehicle thefts for 2019, which revealed a decrease in first quarter incidents from the same time period last year. For neighborhood boundaries, we rely on the borders defined by the Los Angeles Times. Learn more about our data here.
LAPD data only reflect crimes that are reported to the department, not how many crimes actually occurred. In making our calculations, we rely on the data the LAPD makes publicly available. On occasion, LAPD may update past crime reports with new information, or recategorize past reports. Those revised reports do not always automatically become part of the public database.
Want to know how your neighborhood fares? Or simply just interested in our data? Email us at askus@xtown.la.


