Is crime in your neighborhood going down?
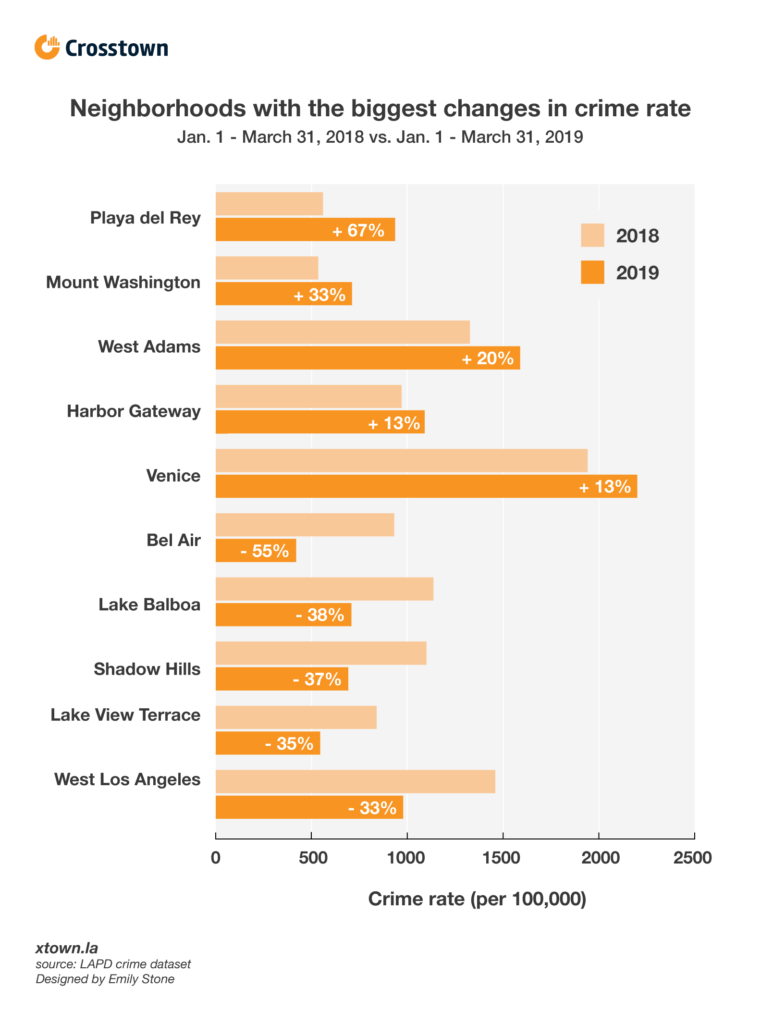
If you live in Bel Air, Lake Balboa, Shadow Hills, Lake View Terrace or West Los Angeles, you may be feeling safer this year.
That’s because the crime rates in those Los Angeles neighborhoods have gone down during the first quarter of this year compared to the same time period last year.
Crime rate is calculated by dividing the total number of reported crimes by the population of that neighborhood and then multiplying that number by 100,000.
There were 50,274 crimes reported in the City of Los Angeles in the first quarter of this year — an 8% dip from the same period the previous year.
For Bel Air, the crime rate dropped by 55%.
For those living in the neighborhoods of Playa del Rey, Mount Washington, West Adams, Venice and Harbor Gateway the crime rate worsened.
In Playa del Rey, there was a 67% increase in crime rate from the first quarter of 2018 to the first quarter of this year.
To see where your neighborhood falls, read our story on how Los Angeles crime rate fell in the first quarter. We examined crimes reported to the LAPD for 110 Los Angeles neighborhoods from Jan. 1 – March 31, 2019 and ranked them according to crime rate.
Shirsho Dasgupta contributed to this report.

How we did it: We broke out the crime rate for each neighborhood to provide residents with a more nuanced understanding of how public safety is playing out across the city. You can read our neighborhood breakdown of burglary rates here.
For our calculations, we looked at reports of all crimes, from assault to vandalism. However, whether a neighborhood feels safe to its residents depends as much on perception as on actual data. In our analysis, we did not differentiate between property and violent crimes. Sometimes a neighborhood may have a low general crime rate but a higher number of violent crimes. Such an area might be less safe than one with a higher overall rate but fewer violent offenses.
For neighborhood boundaries, we rely on the borders defined by the Los Angeles Times. Learn more about our data here.
LAPD data only reflects crimes that are reported to the department, not how many crimes actually occurred. In making our calculations, we rely on the data that the LAPD makes publicly available. On occasion, LAPD may update past crime reports with new information, or recategorize past reports. Those revised reports do not always automatically become part of the public database.
Want to know how your neighborhood fares? Or simply just interested in our data? Email us at askus@xtown.la.


