

Road rage rising


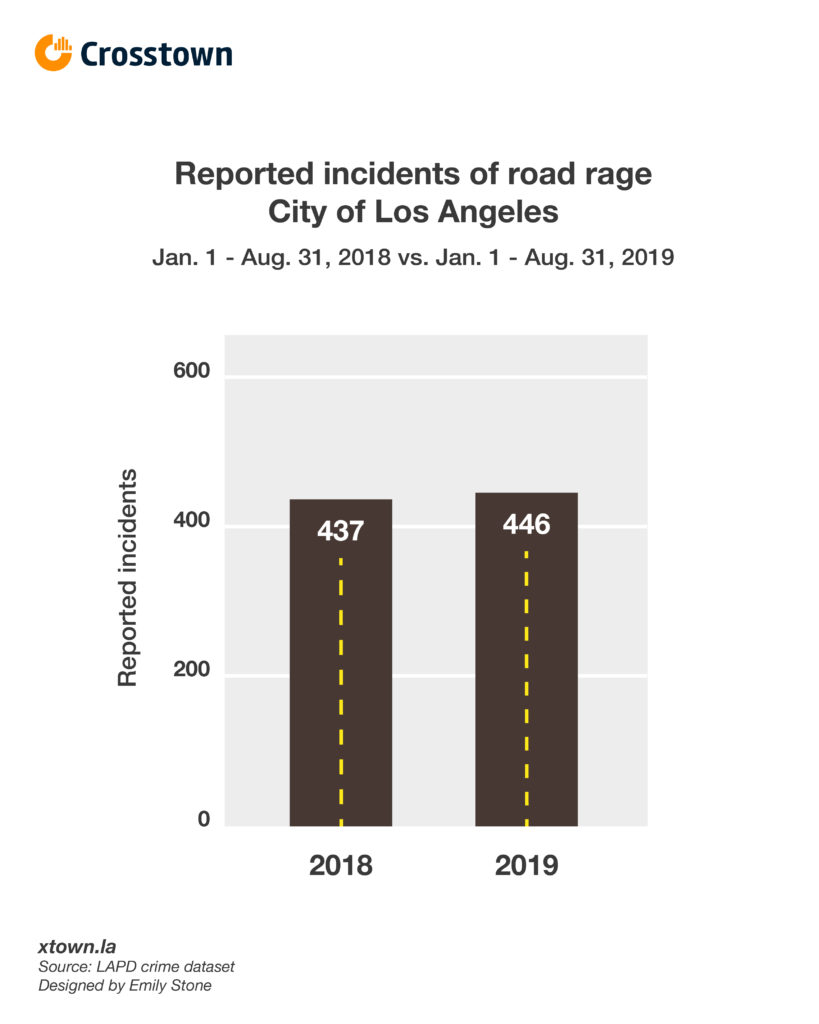
Road rage incidents in the City of Los Angeles increased 2% in the first eight months of 2019 compared to the same time last year, according to publicly available LAPD data.
These reports aren’t just about blowing the horn at someone who didn’t take off fast enough at a green light. For the first eight months of this year, 36% of road rage incidents included assault with a deadly weapon or aggravated assault.
One recent incident of road rage occurred at 12:15 in the afternoon on Jan. 6 at the intersection of Langon Ave. and Devonshire St. in Mission Hills. The data show that the suspect spat on a 29-year-old black woman. The suspect cursed at her, used racial slurs and brandished a weapon. The suspect then followed her home. The LAPD categorized this as a hate crime, and arrested an adult for it.
About 14% of reported road rage incidents included vandalism; 4.2% included people making criminal threats without using a weapon.
Road rage in the City of Los Angeles has consistently increased since data was made public by the LAPD. In 2010, there were 196 reports of road rage. In 2018, there were 659, a 236% increase in nine years. The biggest percentage spike from one year to the next happened in 2016, when reports of road rage spiked 45% from 369 to 539. That also happened to be a presidential election year.
The most common day for road rage incidents in 2018 was Friday with 118 reports. Doesn’t seem surprising since people are trying to get their weekend started. Tuesday came in second with 109 reports. Maybe drivers were late for tacos?
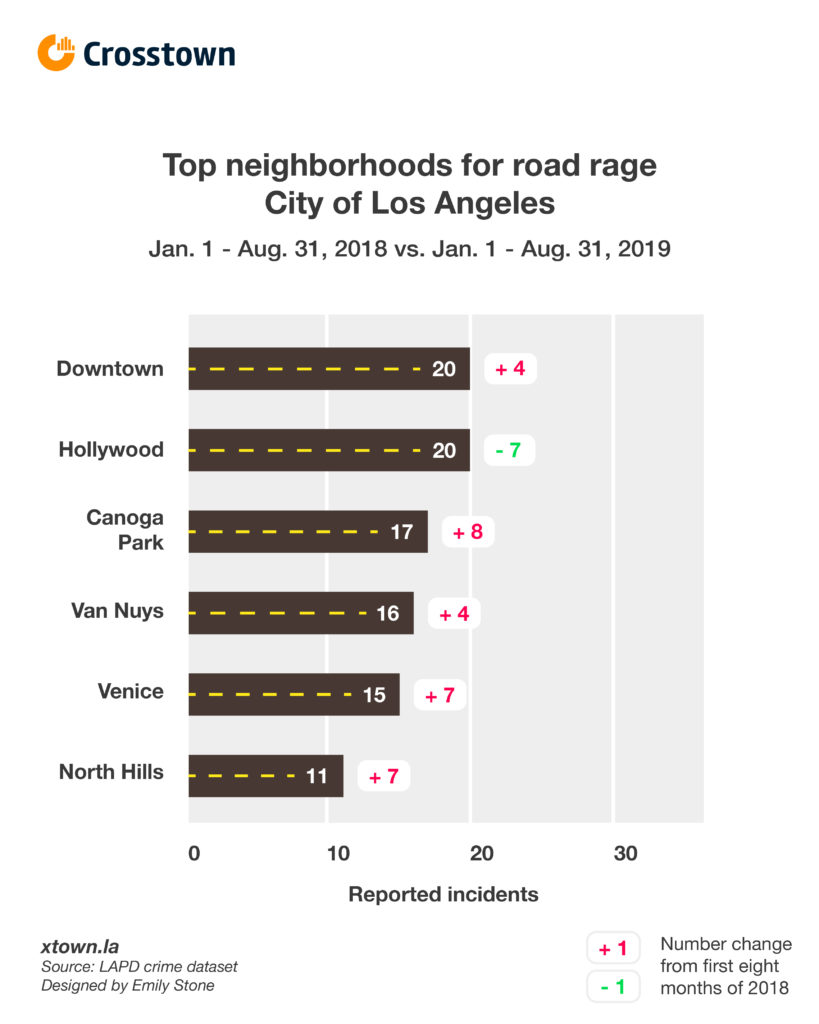
As a safety precaution, you may want to have your favorite calming soundtrack or a stress ball on hand if you’re driving in these neighborhoods. They all made the list for most reported cases of road rage in the first eight months of 2019.
How we did it: We examined LAPD publicly available data on reported crimes that involved road rage for the first eight months of 2019 compared to the same time last year. For neighborhood boundaries, we rely on the borders defined by the Los Angeles Times. Learn more about our data here.
LAPD data only reflect crimes that are reported to the department, not how many crimes actually occurred. In making our calculations, we rely on the data the LAPD makes publicly available. On occasion, LAPD may update past crime reports with new information, or recategorize past reports. Those revised reports do not always automatically become part of the public database.
Want to know how your neighborhood fares? Or simply just interested in our data? Email us at askus@xtown.la.


