

Which is riskier: taking an Uber or driving one?


There were more reported crimes against Uber and Lyft drivers than by them in the City of Los Angeles, according to LAPD publicly available data.
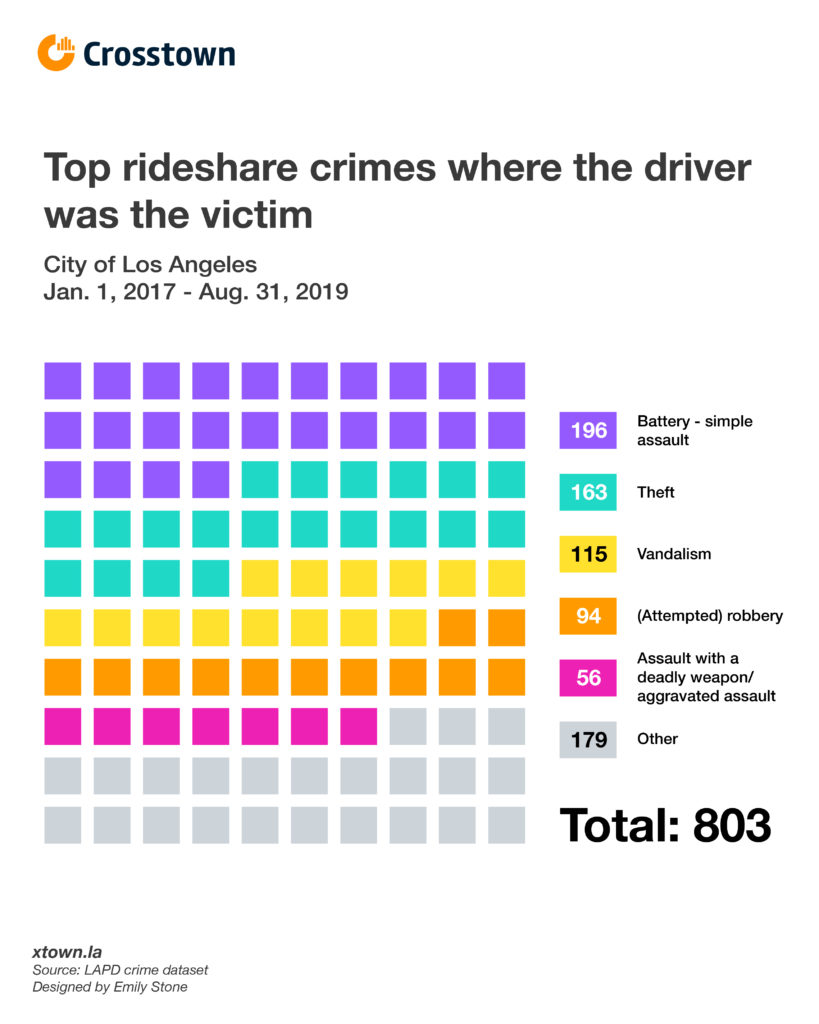
From Jan. 1, 2017 – Aug. 31, 2019, the LAPD recorded 496 crimes where an Uber or Lyft driver was the suspect. The number of cases where they were identified as the victim was 60% higher, at 802.
The trend seems to be getting worse. In comparing the first eight months of 2019 to the same period last year, the number of reported crimes against rideshare drivers increased 80%, to 307 cases. The number of crimes by rideshare drivers held fairly steady, with 144 reported from Jan. 1 – Aug. 31, 2019, compared with 149 during the same period in 2018.
In the past two years, the top five types of crimes against drivers were assault without severe injury, theft, vandalism, robbery and aggravated assault. Eighty percent of victims of such crimes were male. Though, a recent study found that 77% of Lyft drivers in Los Angeles were male, so it makes sense that if more males are drivers in general that more males would be victims of crimes.
In 6% of all crimes against drivers from Jan. 1, 2017 – Aug. 31, 2019, a hand gun or knife was involved.
“The data is pretty consistent with the stories we hear,” said Tyler Sandness, driver and outreach organizer of Rideshare Drivers United, a Los Angeles-based association of drivers.
According to Sandness, the rideshare apps provide a profile of the incoming passengers, but the profile is not necessarily consistent with the person they are actually picking up, since people can order rides remotely for someone else.
“There has been this stigma of drivers for being unknown and potentially dangerous,” he said. “The reality is that drivers are more likely to be the victim of crimes.”
In terms of future solutions, Sandness said the organization does not have any specific policy proposal at this moment.
“But we are eager to work with partners at City Hall to make sure that drivers are part of the conversation when it comes to promoting safety,” he said.
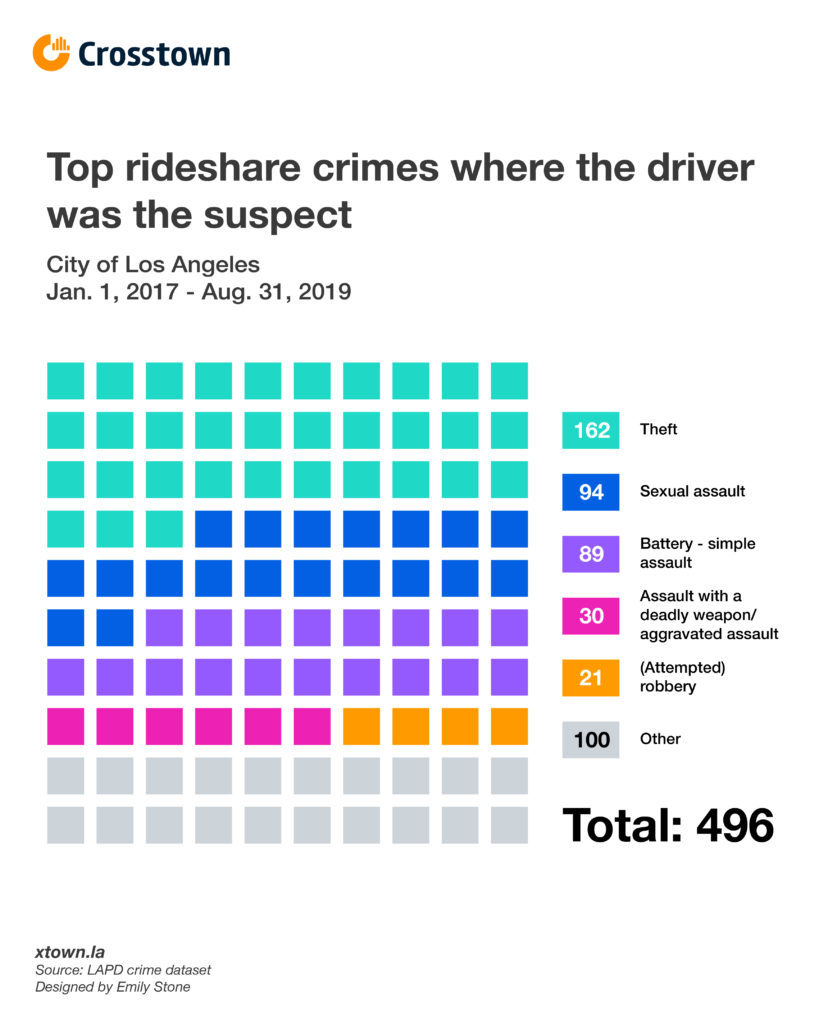
On the flip side, in cases where an Uber of Lyft driver was the suspect, theft was the most common offense. Sexual assault, the most covered Uber/Lyft crime in news media, was the second most common offense, representing 19% of driver-on-passenger crimes. During the first eight months of 2019, there were 23 reported sexual assault crimes committed by rideshare drivers. Women were the victims in 82 out of 94 sexual assault cases from Jan. 2017 to Aug. 2019.
Assault without severe injury was the third most common driver-on-passenger crime, constituting 18% of the reports, according to LAPD data. The crimes in fourth and fifth places were robbery and aggravated assault.
In all 496 crimes committed by Uber of Lyft drivers, 46% of victims were between 19 and 29 years old. Two victims were under 13 years old. The eldest was a 71-year-old white female who fell victim to petty theft on Feb. 16, 2018 in Beverlywood, the data shows.
About half of all crimes related to Uber or Lyft occurred on Saturdays and Sundays. Thanksgiving and Christmas Eve seem to be two of the safest days to ride with strangers over the past two years in the City of Los Angeles, as no Uber or Lyft driver committed a crime on those days in the past two years, according to the data.
But Uber and Lyft drivers were still subject to theft from vehicles on holidays. A 46-year-old Hispanic driver found her car window smashed and property stolen on Christmas Eve last year in a parking lot at 600 N. Figueroa St. in Downtown.
How we did it: We examined LAPD publicly available data on reported crimes that contains the MO code “suspect was Uber/Lyft driver” and “victim was Uber/Lyft driver” from Jan. 1 2017 – Aug. 30, 2019. For robberies, we include robbery and attempted robbery. For neighborhood boundaries, we rely on the borders defined by the Los Angeles Times. Learn more about our data here.
LAPD data only reflect crimes that are reported to the department, not how many crimes actually occurred. In making our calculations, we rely on the data the LAPD makes publicly available. On occasion, LAPD may update past crime reports with new information, or recategorize past reports. Those revised reports do not always automatically become part of the public database.
Want to know how your neighborhood fares? Or simply just interested in our data? Email us at askus@xtown.la.


