

Women drivers? Ahem, they are not the problem


Women are paid less than men, land fewer leading roles in Hollywood and are less likely to get promoted. Oh, and they also get in fewer car accidents, at least in Los Angeles.
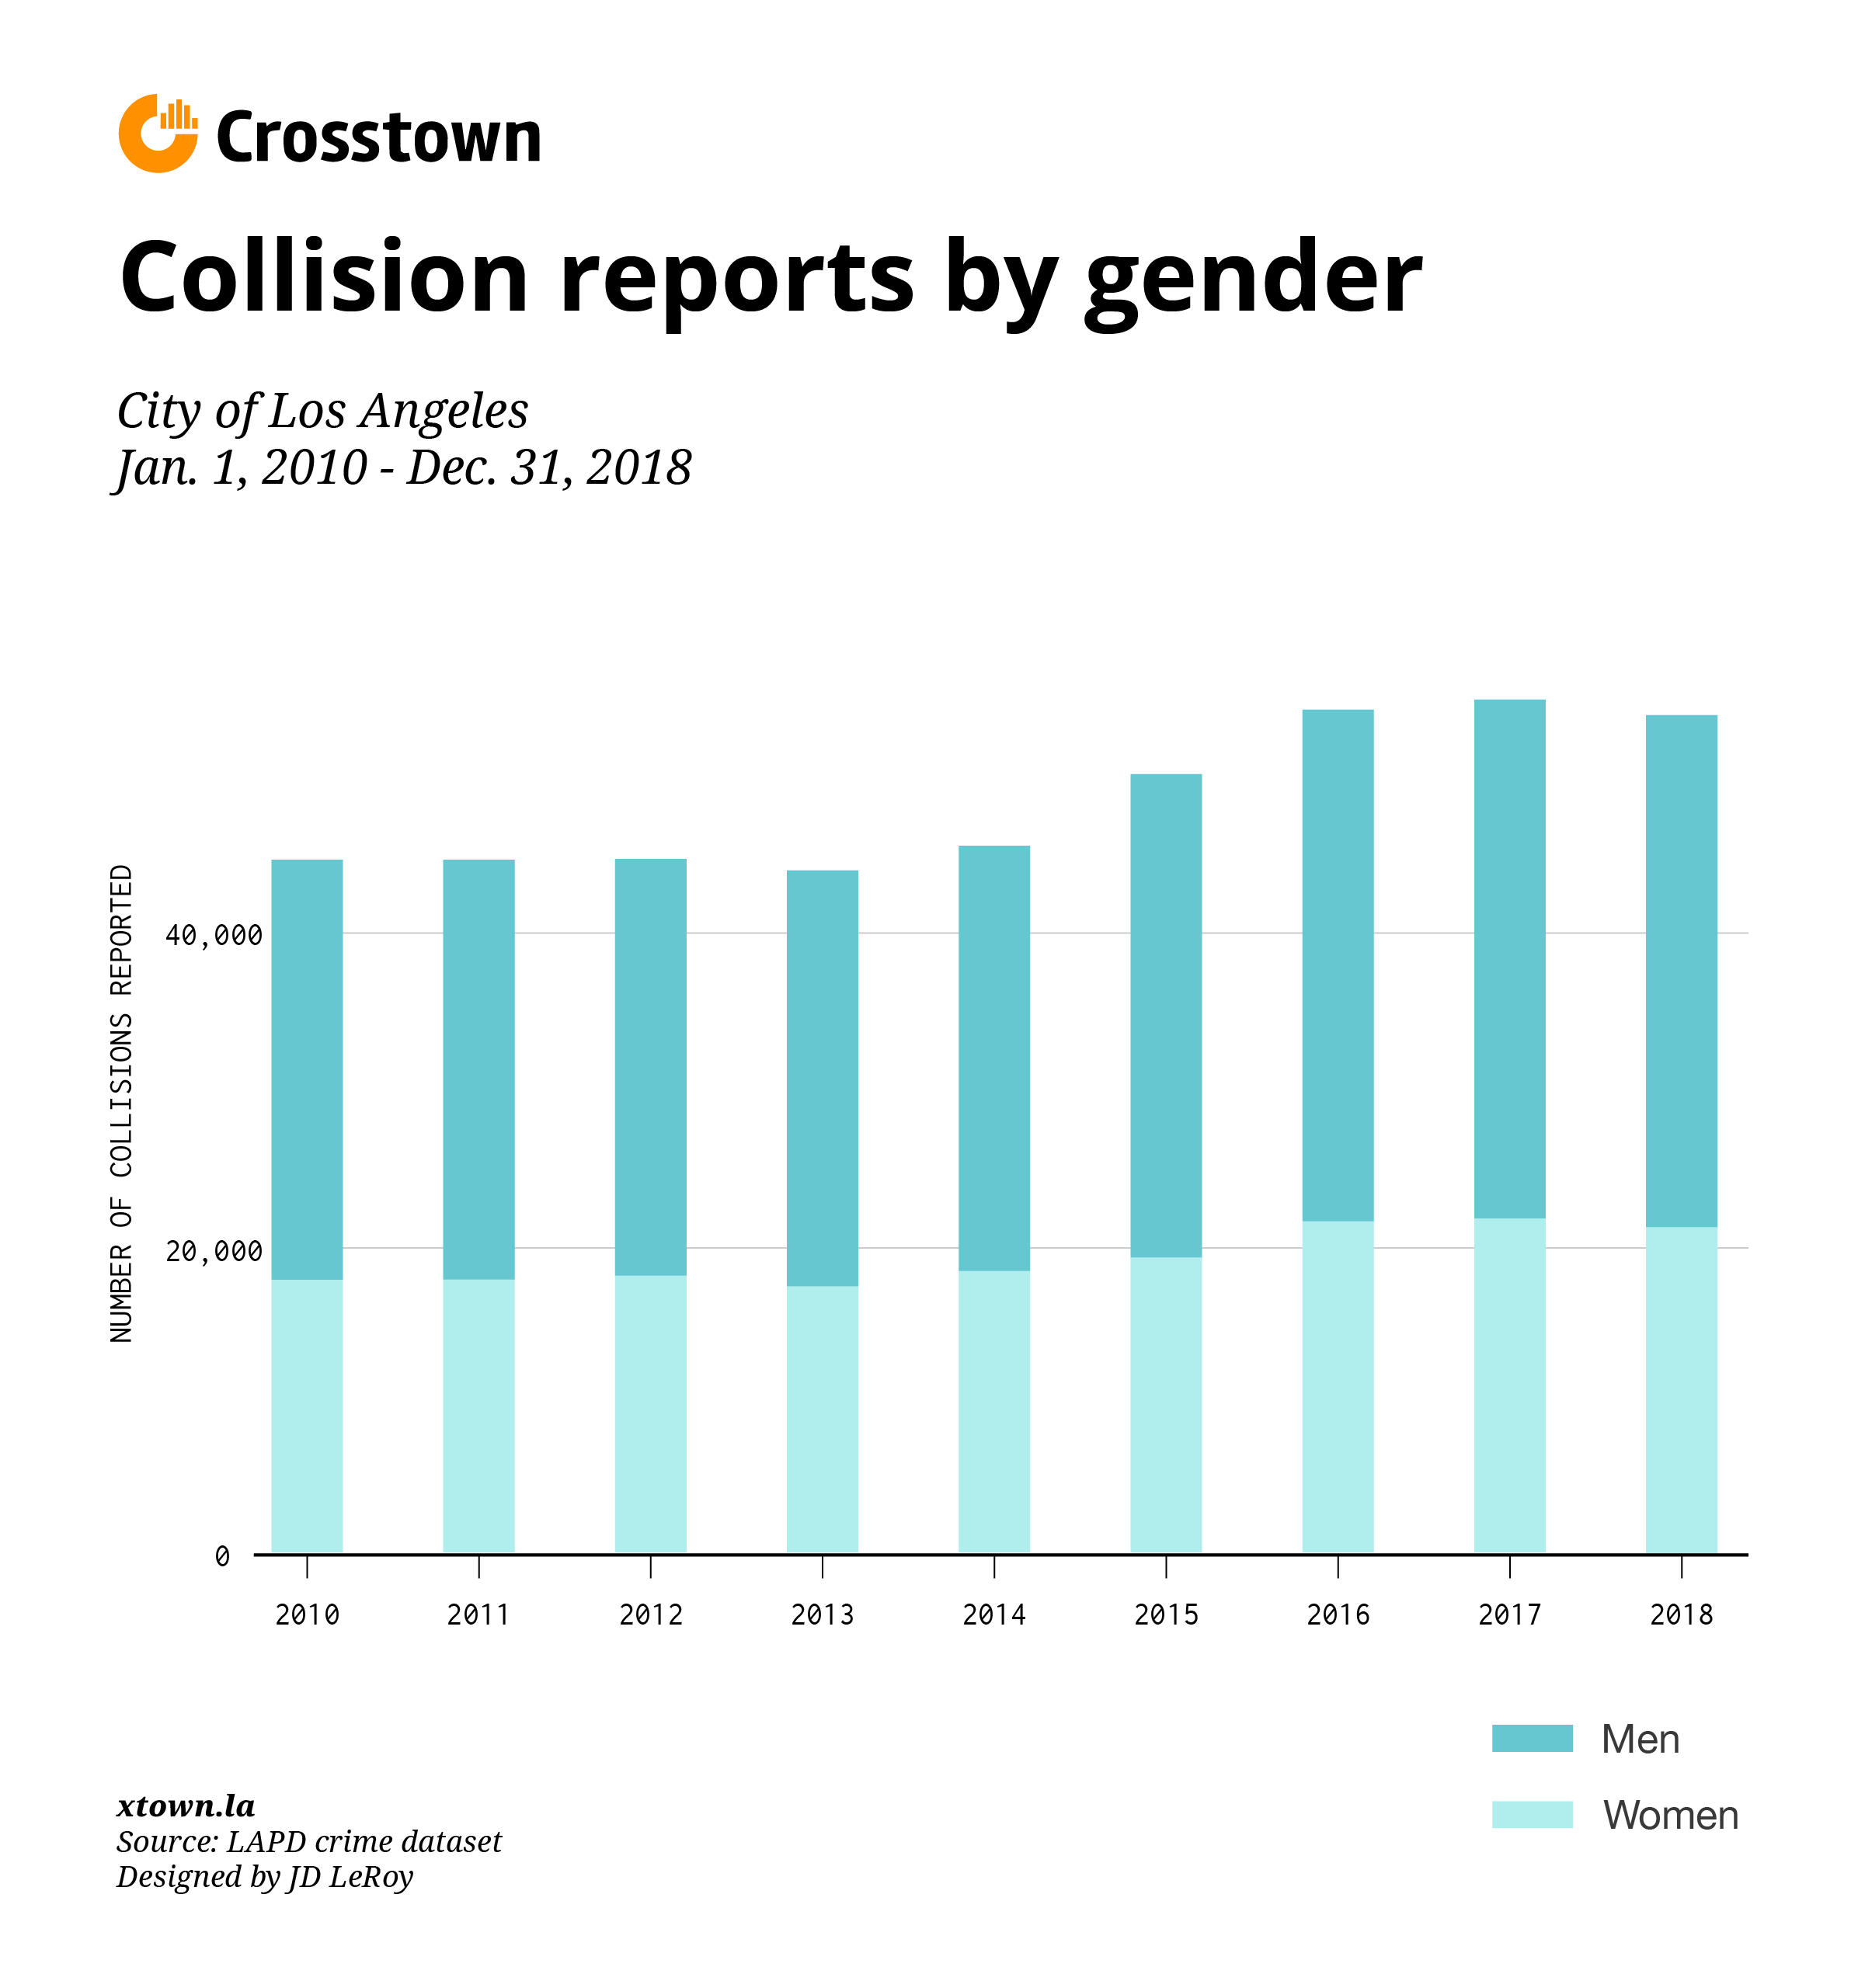
Crosstown analyzed data from nearly half a million traffic accidents in the city over the past decade. In each year, men were responsible for around 60% of accidents, while women were responsible for around 40%, according to LAPD data. Which brings up the question: Are women just better drivers?
Essentially, yes.
“I was involved in several collisions as a young male driver,” said Lt. David Ferry of the Los Angeles Police Department’s Traffic Coordination Section. “For me, it was overconfidence while my driving skill set was still developing.”
Ferry is also the spokesman for Vision Zero, an initiative taken on by Los Angeles and other cities around the world to eliminate traffic fatalities to zero by 2025. “The higher percentage of male drivers [being involved in collisions] is known to everyone around the Vision Zero table,” he said.
Collisions can include vehicles, pedestrians, cyclists or property, according to LAPD data.

Men make up a slightly higher number of registered drivers in Los Angeles County, at 51%, compared to women, who make up 49% of registered drivers, according to the California Department of Motor Vehicles. (The DMV does not break down registrations by city.) Statewide, the breakdown is about the same: Men make up nearly 51% of California drivers, and women make up 49%. Non-binary people account for a small percentage as well.
Yet during the first nine months of 2019, men were responsible for 23,641 traffic collisions in the city. Women were responsible for 15,527 during the same period. That means men were primarily responsible for more collisions than women this year. There were 1,913 collisions during this time for which the LAPD listed an “unknown” gender. In 878 collisions, gender was left blank.
At 3:45 p.m. on Oct. 10, Matthew Gottula, 30, a North Hills resident, was stopped in his 2015 Mazda 3 vehicle near the intersection of Balboa Blvd. and Sherman Way in Lake Balboa.
A 21-year-old driving a 2008 Lexus rear-ended a Honda that was behind Gottula. The Honda crashed into him, causing a chain reaction that left all three cars damaged.
“I’ve been on the road since I got my license at 16 years old, and this is the first multi-car auto accident I’ve been involved in,” said Gottula. “I have a clean driving record. … I was definitely not at fault.”
Gottula said that he believes men typically drive more aggressively than women.
“That’s why young men, including myself, pay higher premiums than young women,” he said. “It’s a burden I am taking on due to other risky male drivers like the one that caused this accident.”
Men paying more in insurance is as big a myth as women being bad drivers.
At the beginning of the year, outgoing state insurance commissioner Dave Jones issued regulations prohibiting the use of gender in individual automobile insurance ratings. Several studies revealed women over 25, particularly those between the ages of 40 and 60, were paying more for auto insurance than similarly aged men.
Jones said his priorities were protecting consumers and making sure California has a functional insurance market that provides people with insurance products they need, regardless of gender.
Prior to the new regulations, Jones said the way insurance companies used gender to determine rates was “all over the map.”
“We concluded that gender was not useful in predicting the likelihood of a loss,” said Jones. “Given that gender is an immutable characteristic … it wasn’t supportable in the long run to be used as a factor in setting auto insurance rates.”
How we did it: We examined LAPD publicly available data on reported traffic collisions during the first nine months of 2019 compared to the same time period last year. Party 1 is generally the person at fault, so a driver would be listed first, then a pedestrian, then a parked vehicle, then a bicyclist, then “other.” For neighborhood boundaries, we rely on the borders defined by the Los Angeles Times. Learn more about our data here.
LAPD data only reflect crimes that are reported to the department, not how many crimes actually occurred. In making our calculations, we rely on the data the LAPD makes publicly available. On occasion, LAPD may update past crime reports with new information, or recategorize past reports. Those revised reports do not always automatically become part of the public database.
Want to know how your neighborhood fares? Or simply just interested in our data? Email us at askus@xtown.la.


