

Burglaries drop steeply across Los Angeles


Home break-ins often hit wealthy neighborhoods hardest. Windsor Square, Beverly Grove and Rancho Park all have some of the highest burglary rates in the city, with 837, 781 and 741 burglaries per 100,000 people, respectively. But this year, the numbers fell consistently across the city.
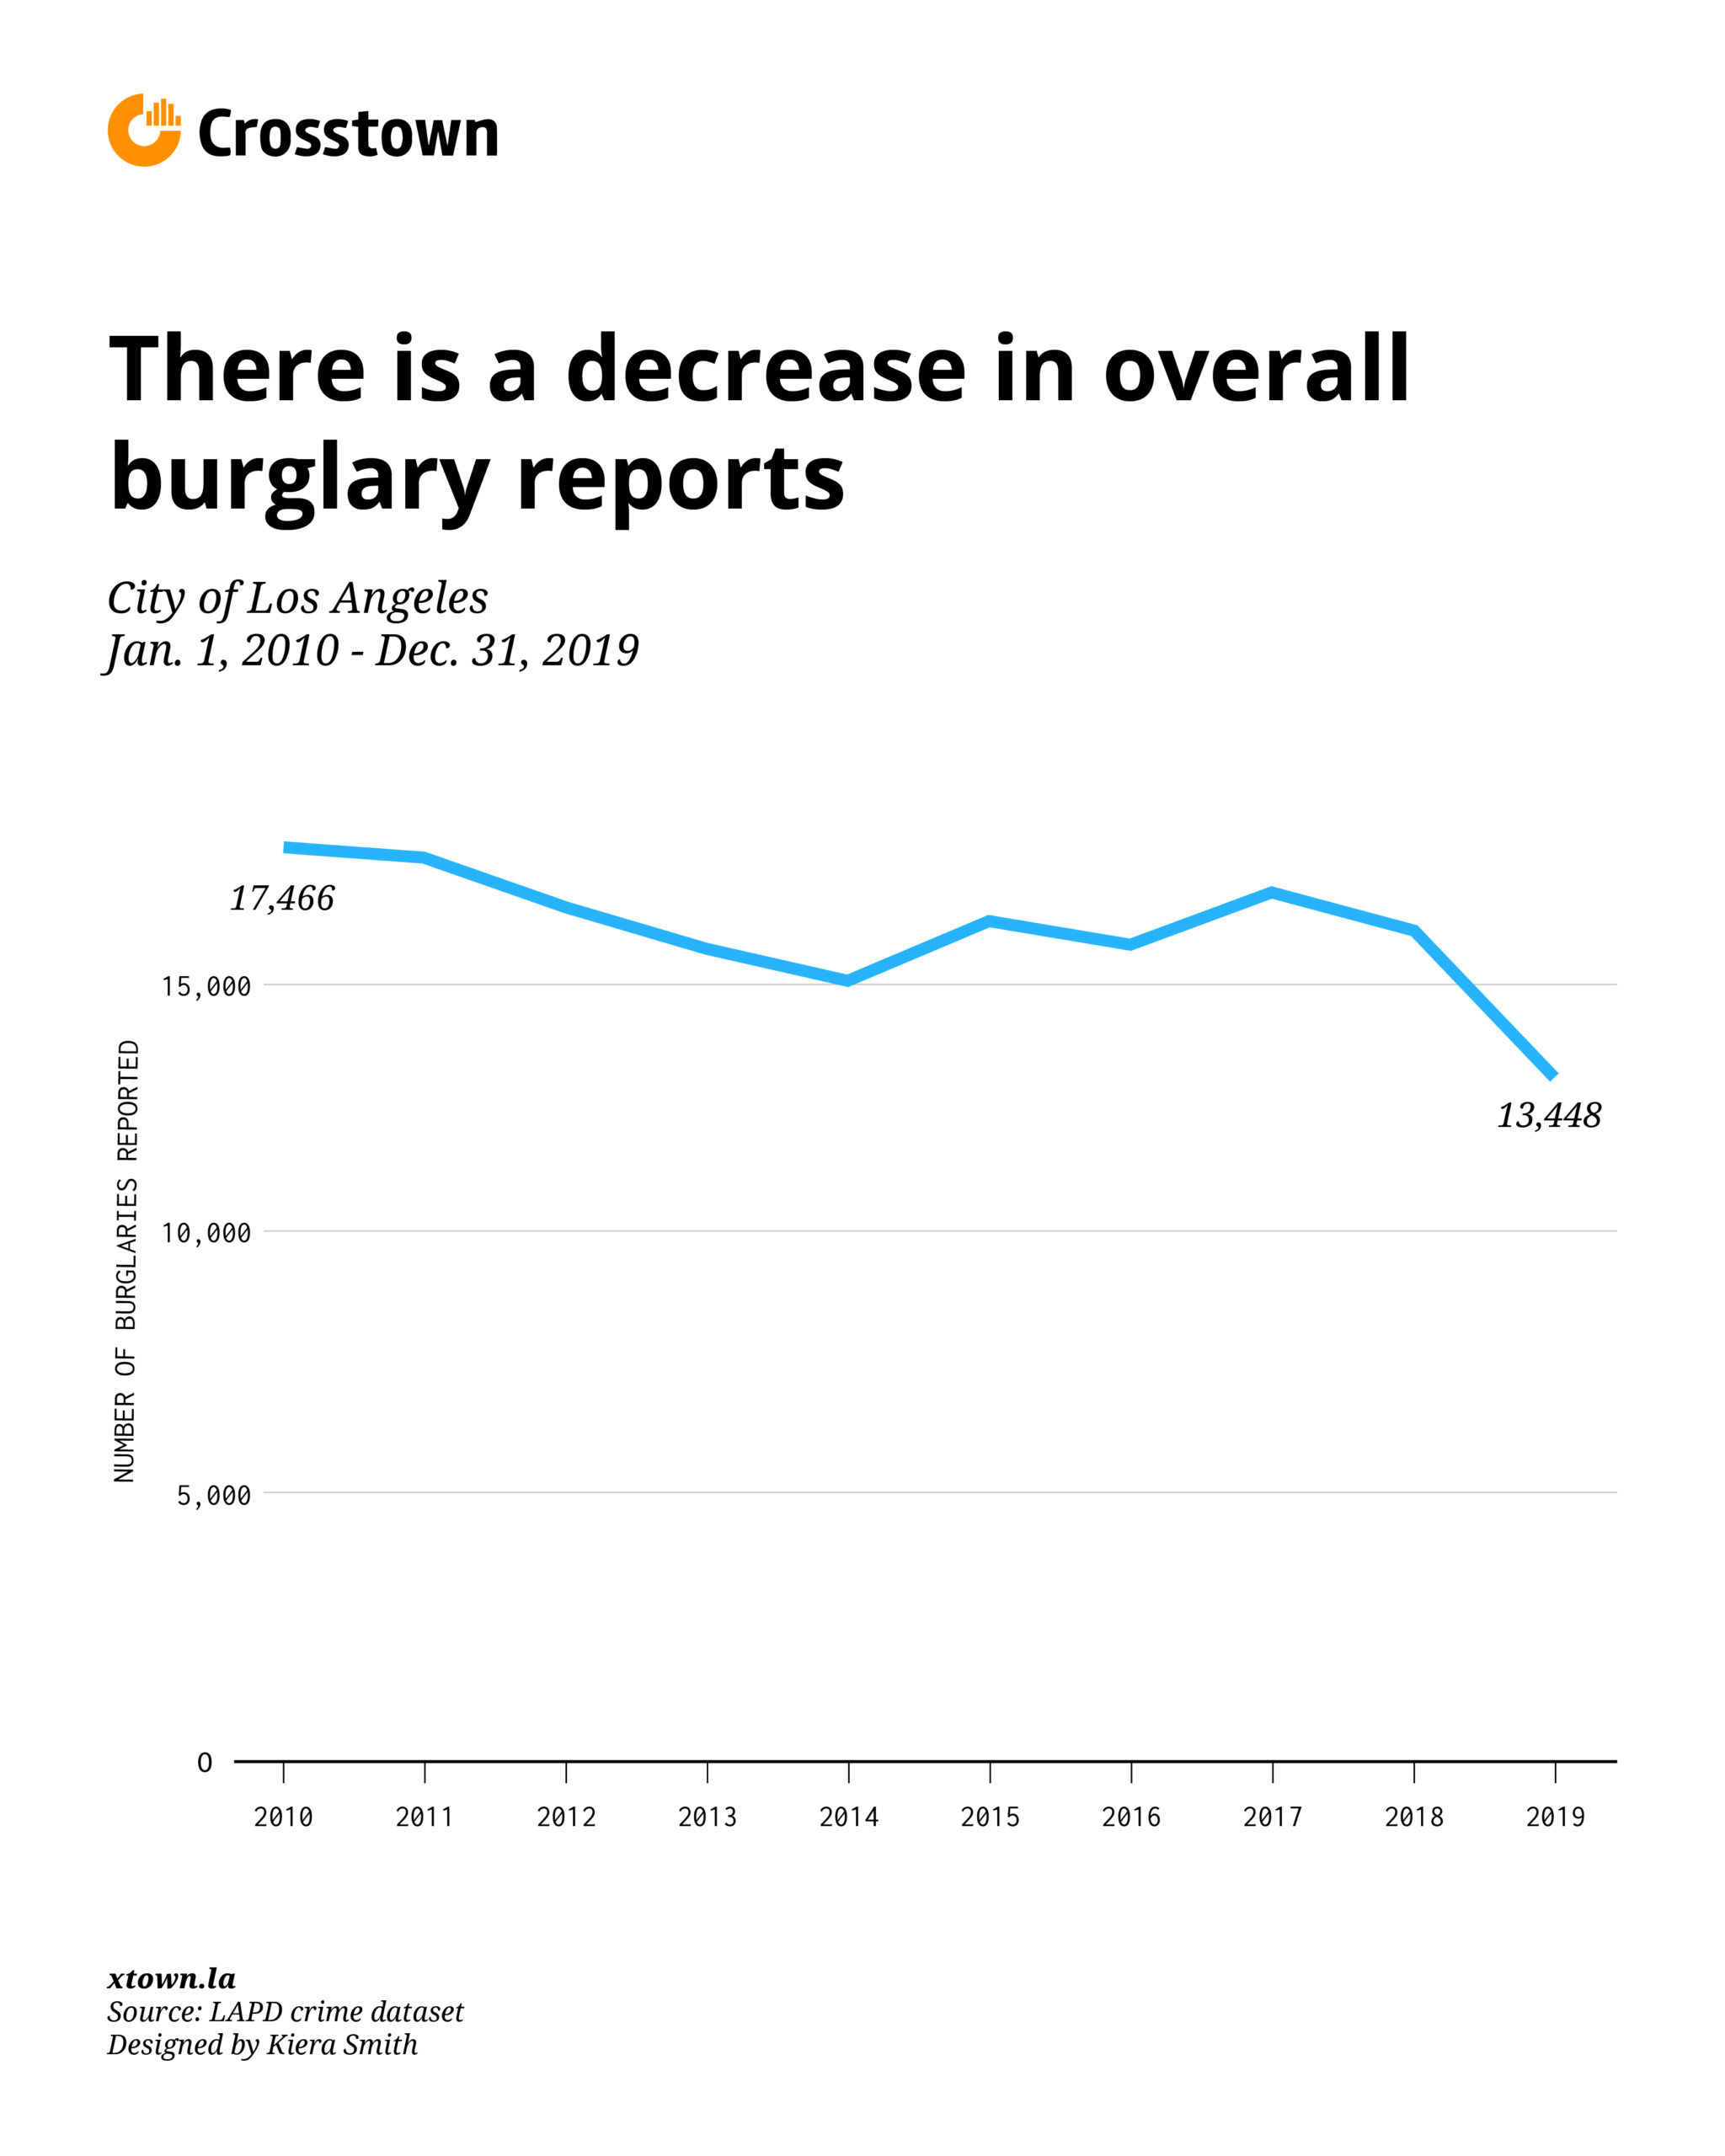
There were 13,448 reports of burglaries in the City of Los Angeles in 2019. This marks a 16% drop from 2018, which had 15,998 incidents. Burglaries are down 23% from 2010, the earliest year for which publicly available data exists.
The decrease is happening across the city. In 2019, 86 out of 110 neighborhoods saw decreases in reported burglaries, according to LAPD data. Leimert Park, Cheviot Hills and Chesterfield Square saw the biggest reductions, at 55%, 50% and 48%, respectively.
Twenty-two neighborhoods saw increases in burglary reports. Mount Washington, Elysian Valley and Chinatown had the biggest jumps for 2019, with 90%, 38% and 27%, respectively. Two neighborhoods, South Park and Playa del Rey, saw no change at all.
The LAPD did not respond to repeated requests for comment.
Reports of burglaries have fluctuated, but generally have been on a decline since 2010. That was also the year with the most reports of burglaries or attempted burglaries, with 17,466. The second-best year for property owners (and the second-worst year for bandits) was 2014, with 15,127 reported break-ins.
But numbers are not everything. Burglaries play out differently across different neighborhoods based on how wealthy a neighborhood is and how comfortable its residents are reporting crimes to the police.
Echo Park was one of the few LA neighborhoods that registered an increase, with 13% more burglaries last year. According to Lauren Buisson, a 40-year resident of Echo Park and a member of the Echo Park Neighborhood Council, demographic transitions played a role making her neighborhood more of a target. Buisson believes the impacts of gentrification and economic downturns might be impacting neighborhood safety.
“Newcomers tend to think their relative wealth insulates them. It’s just common sense not to leave your laptop visible where people can get to it,” Buisson said.
But Buisson is hesitant to chalk Echo Park’s uptick in burglaries to a single factor.
“It’s not just poverty and homelessness that cause crime,” she said.
Where does your neighborhood stand?
Click on the arrows in the table to sort by category. Click once to see the category in ascending order, and again to see it in descending order. Use the search bar to find your neighborhood. (The number column refers to alphabetical order.)
| Neighborhood | Burglary count (2010-19) | Burglary count (2019) | Burglary count (2018) | Total Population | Burglary Rate (2019) | Burglary Rate (2018) | Change (2019-18) |
| Adams-Normandie | 446 | 35 | 49 | 17925 | 195 | 273 | -29% |
| Arleta | 842 | 50 | 42 | 33780 | 148 | 124 | 19% |
| Arlington Heights | 631 | 46 | 76 | 23768 | 194 | 320 | -39% |
| Atwater Village | 396 | 28 | 31 | 11206 | 250 | 277 | -10% |
| Baldwin Hills Crenshaw | 2216 | 109 | 155 | 29672 | 367 | 522 | -30% |
| Bel-Air | 319 | 29 | 46 | 7615 | 381 | 604 | -37% |
| Beverly Crest | 482 | 47 | 56 | 11266 | 417 | 497 | -16% |
| Beverly Grove | 1614 | 172 | 216 | 22023 | 781 | 981 | -20% |
| Beverlywood | 340 | 44 | 52 | 7244 | 607 | 718 | -15% |
| Boyle Heights | 2122 | 237 | 249 | 92036 | 258 | 271 | -5% |
| Brentwood | 1453 | 149 | 191 | 32865 | 453 | 581 | -22% |
| Broadway-Manchester | 1946 | 121 | 148 | 28280 | 428 | 523 | -18% |
| Canoga Park | 2174 | 181 | 217 | 59641 | 303 | 364 | -17% |
| Carthay | 412 | 30 | 32 | 5356 | 560 | 597 | -6% |
| Central Alameda | 922 | 49 | 55 | 43129 | 114 | 128 | -11% |
| Century City | 292 | 37 | 47 | 6175 | 599 | 761 | -21% |
| Chatsworth | 2250 | 192 | 238 | 50435 | 381 | 472 | -19% |
| Chesterfield Square | 589 | 37 | 71 | 8247 | 449 | 861 | -48% |
| Cheviot Hills | 556 | 50 | 100 | 8747 | 572 | 1143 | -50% |
| Chinatown | 236 | 28 | 22 | 13687 | 205 | 161 | 27% |
| Cypress Park | 247 | 18 | 27 | 9786 | 184 | 276 | -33% |
| Del Rey | 1194 | 96 | 105 | 30010 | 320 | 350 | -9% |
| Downtown | 3489 | 422 | 436 | 50085 | 843 | 871 | -3% |
| Eagle Rock | 1151 | 93 | 118 | 34233 | 272 | 345 | -21% |
| East Hollywood | 1614 | 132 | 188 | 68503 | 193 | 274 | -30% |
| Echo Park | 1136 | 117 | 104 | 34950 | 335 | 298 | 13% |
| El Sereno | 880 | 73 | 81 | 42077 | 173 | 193 | -10% |
| Elysian Park | 59 | 9 | 8 | 2386 | 377 | 335 | 13% |
| Elysian Valley | 233 | 47 | 34 | 7404 | 635 | 459 | 38% |
| Encino | 2814 | 297 | 353 | 45712 | 650 | 772 | -16% |
| Exposition Park | 1369 | 84 | 77 | 35235 | 238 | 219 | 9% |
| Fairfax | 1119 | 98 | 136 | 13484 | 727 | 1009 | -28% |
| Florence | 2281 | 176 | 164 | 52639 | 334 | 312 | 7% |
| Glassell Park | 754 | 80 | 99 | 24084 | 332 | 411 | -19% |
| Gramercy Park | 877 | 46 | 64 | 10666 | 431 | 600 | -28% |
| Granada Hills | 2728 | 188 | 213 | 53296 | 353 | 400 | -12% |
| Green Meadows | 1860 | 107 | 129 | 34848 | 307 | 370 | -17% |
| Hancock Park | 910 | 66 | 124 | 10774 | 613 | 1151 | -47% |
| Harbor City | 860 | 82 | 81 | 25833 | 317 | 314 | 1% |
| Harbor Gateway | 1743 | 140 | 180 | 41308 | 339 | 436 | -22% |
| Harvard Heights | 520 | 38 | 56 | 19497 | 195 | 287 | -32% |
| Harvard Park | 600 | 40 | 73 | 9423 | 424 | 775 | -45% |
| Highland Park | 1058 | 71 | 95 | 53013 | 134 | 179 | -25% |
| Historic South Central | 1503 | 127 | 119 | 48700 | 261 | 244 | 7% |
| Hollywood | 2798 | 277 | 299 | 73119 | 379 | 409 | -7% |
| Hollywood Hills | 1231 | 122 | 133 | 21296 | 573 | 625 | -8% |
| Hollywood Hills West | 796 | 80 | 100 | 15965 | 501 | 626 | -20% |
| Hyde Park | 2708 | 143 | 267 | 35461 | 403 | 753 | -46% |
| Jefferson Park | 887 | 64 | 95 | 25339 | 253 | 375 | -33% |
| Koreatown | 3223 | 241 | 335 | 107316 | 225 | 312 | -28% |
| Lake Balboa | 1301 | 74 | 96 | 27115 | 273 | 354 | -23% |
| Lakeview Terrace | 385 | 28 | 47 | 13579 | 206 | 346 | -40% |
| Larchmont | 435 | 38 | 63 | 8595 | 442 | 733 | -40% |
| Leimert Park | 1145 | 48 | 106 | 12566 | 382 | 844 | -55% |
| Lincoln Heights | 607 | 74 | 68 | 28649 | 258 | 237 | 9% |
| Los Feliz | 1415 | 136 | 180 | 33492 | 406 | 537 | -24% |
| Manchester Square | 756 | 64 | 60 | 11516 | 556 | 521 | 7% |
| Mar Vista | 1481 | 165 | 163 | 37833 | 436 | 431 | 1% |
| Mid-City | 2486 | 272 | 291 | 51962 | 523 | 560 | -7% |
| Mid-Wilshire | 2276 | 185 | 243 | 42682 | 433 | 569 | -24% |
| Mission Hills | 793 | 45 | 67 | 18747 | 240 | 357 | -33% |
| Montecito Heights | 359 | 32 | 29 | 17724 | 181 | 164 | 10% |
| Mount Washington | 383 | 57 | 30 | 14201 | 401 | 211 | 90% |
| North Hills | 1939 | 100 | 155 | 62414 | 160 | 248 | -35% |
| North Hollywood | 2685 | 307 | 268 | 81849 | 375 | 327 | 15% |
| Northridge | 2773 | 195 | 271 | 67555 | 289 | 401 | -28% |
| Pacific Palisades | 900 | 66 | 90 | 24990 | 264 | 360 | -27% |
| Pacoima | 1786 | 112 | 138 | 76726 | 146 | 180 | -19% |
| Palms | 1282 | 109 | 112 | 42746 | 255 | 262 | -3% |
| Panorama City | 1845 | 124 | 159 | 70212 | 177 | 226 | -22% |
| Pico-Robertson | 963 | 92 | 123 | 18307 | 503 | 672 | -25% |
| Pico-Union | 1010 | 104 | 83 | 42187 | 247 | 197 | 25% |
| Playa Del Rey | 492 | 41 | 41 | 11434 | 359 | 359 | 0% |
| Playa Vista | 587 | 59 | 65 | 11126 | 530 | 584 | -9% |
| Porter Ranch | 1253 | 89 | 134 | 26040 | 342 | 515 | -34% |
| Rancho Park | 423 | 41 | 45 | 5531 | 741 | 814 | -9% |
| Reseda | 2249 | 160 | 169 | 71569 | 224 | 236 | -5% |
| San Pedro | 3700 | 213 | 283 | 80601 | 264 | 351 | -25% |
| Sawtelle | 1813 | 262 | 294 | 42223 | 621 | 696 | -11% |
| Shadow Hills | 582 | 71 | 60 | 12999 | 546 | 462 | 18% |
| Sherman Oaks | 3111 | 294 | 373 | 71575 | 411 | 521 | -21% |
| Silver Lake | 1435 | 156 | 168 | 31189 | 500 | 539 | -7% |
| South Park | 1130 | 86 | 86 | 33339 | 258 | 258 | 0% |
| Studio City | 2259 | 267 | 285 | 39851 | 670 | 715 | -6% |
| Sun Valley | 2789 | 260 | 249 | 71743 | 362 | 347 | 4% |
| Sunland | 631 | 30 | 52 | 14614 | 205 | 356 | -42% |
| Sylmar | 2343 | 129 | 147 | 80327 | 161 | 183 | -12% |
| Tarzana | 2436 | 254 | 272 | 37739 | 673 | 721 | -7% |
| Toluca Lake | 460 | 62 | 69 | 9192 | 674 | 751 | -10% |
| Tujunga | 929 | 59 | 111 | 27328 | 216 | 406 | -47% |
| University Park | 1016 | 86 | 74 | 24170 | 356 | 306 | 16% |
| Valley Glen | 2081 | 168 | 200 | 58495 | 287 | 342 | -16% |
| Valley Village | 987 | 93 | 83 | 25746 | 361 | 322 | 12% |
| Van Nuys | 3558 | 275 | 329 | 111635 | 246 | 295 | -16% |
| Venice | 2858 | 279 | 314 | 34048 | 819 | 922 | -11% |
| Vermont Knolls | 1273 | 91 | 103 | 24031 | 379 | 429 | -12% |
| Vermont Slauson | 1394 | 91 | 134 | 21634 | 421 | 619 | -32% |
| Vermont Square | 2045 | 131 | 180 | 26836 | 488 | 671 | -27% |
| Vermont Vista | 1532 | 115 | 180 | 49385 | 233 | 364 | -36% |
| Watts | 2228 | 120 | 111 | 44939 | 267 | 247 | 8% |
| West Adams | 1118 | 93 | 113 | 21328 | 436 | 530 | -18% |
| West Hills | 1560 | 107 | 143 | 39299 | 272 | 364 | -25% |
| West Los Angeles | 852 | 99 | 133 | 12888 | 768 | 1032 | -26% |
| Westchester | 2523 | 199 | 229 | 41193 | 483 | 556 | -13% |
| Westlake | 2907 | 262 | 313 | 107760 | 243 | 290 | -16% |
| Westwood | 1273 | 124 | 200 | 53050 | 234 | 377 | -38% |
| Wilmington | 2210 | 181 | 245 | 58161 | 311 | 421 | -26% |
| Windsor Square | 488 | 56 | 69 | 6694 | 837 | 1031 | -19% |
| Winnetka | 2009 | 138 | 168 | 53895 | 256 | 312 | -18% |
| Woodland Hills | 3920 | 408 | 399 | 67139 | 608 | 594 | 2% |
How we did it: We looked at LAPD publicly available data on reported burglaries and attempted burglaries from 2010. For neighborhood boundaries, we rely on the borders defined by the Los Angeles Times. Learn more about our data here.
LAPD data only reflects crimes that are reported to the department, not how many crimes actually occurred. In making our calculations, we rely on the data that the LAPD makes publicly available. On occasion, LAPD may update past crime reports with new information, or recategorize past reports. Those revised reports do not always automatically become part of the public database.
Want to know how your neighborhood fares? Or simply just interested in our data? Email us at askus@xtown.la.


