

Bucking state trend, LA car thefts decline


It was a bad year for care thieves, but a better year for car owners.
There were 15,623 reports of stolen cars in the City of Los Angeles in 2019, according to publicly available LAPD data. That’s 1,716 fewer vehicles stolen – almost a 10% decline – than in 2018, which saw a total of 17,339 stolen cars.
This decrease is the sharpest drop in a decade of stolen cars. In 2010, there were 17,005 reports of stolen vehicles, a number that decreased slightly every year until there was a sudden spike in car thefts (and for overall crime in LA) in 2015. But after a peak of 19,140 stolen cars 2017, the number of stolen cars started to drop again, putting 2019 on par with 15,480 stolen cars in 2011.
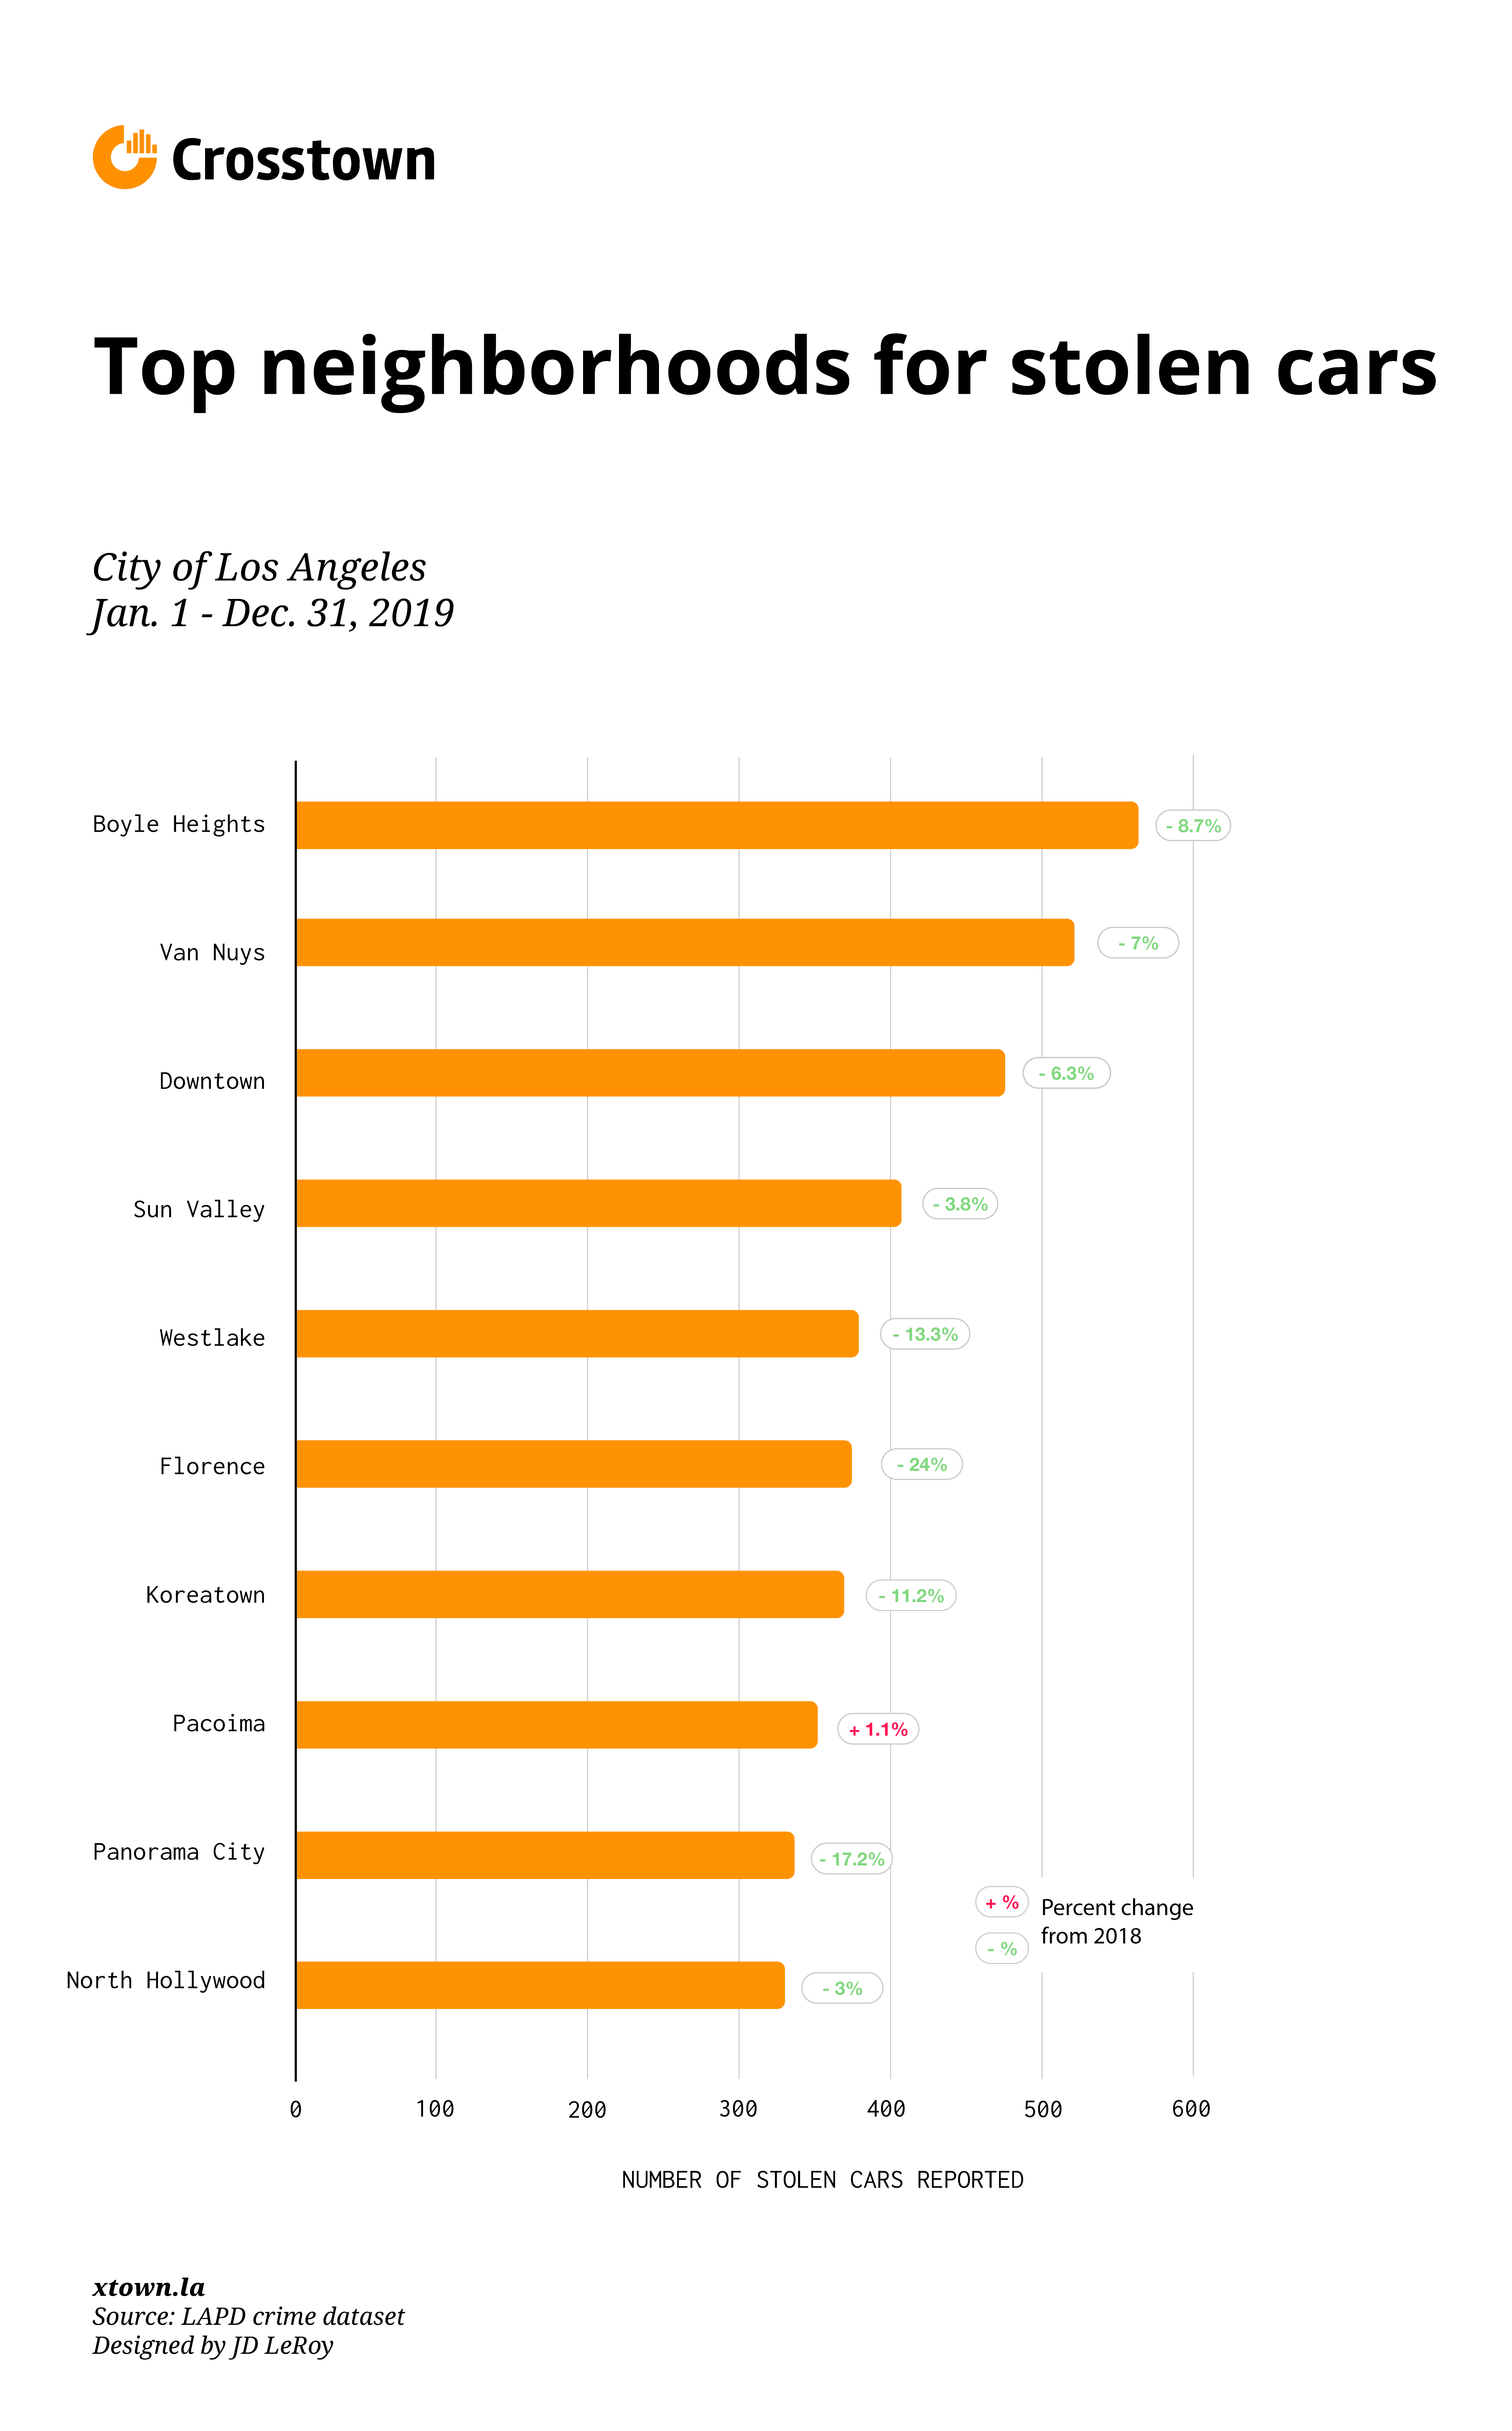
Boyle Heights retained its title as the top neighborhood for stolen cars, with 565 vehicle thefts in 2019. The neighborhood consistently has been at the top of the list during the last decade, except during 2011. Van Nuys came in second, with 519 stolen cars. Downtown had the third highest number of stolen cars reported, with 473. However, all three neighborhoods had decreases in car thefts from 2018.
Out of the top 10 neighborhoods, Florence saw the biggest decrease, where the number of stolen cars dropped by almost a quarter from 2018. Pacoima was the only neighborhood among the top ten that did not experience a decrease in 2019, with almost the same number of stolen cars as 2018.
San Francisco Bay Area cities have seen an explosion in car thefts that prompted lawmakers to propose new legislation. In contrast, the number of car thefts is decreasing in LA, but the effects are still devastating for Angelenos whose cars have been stolen.
Emily Reyes had her car stolen in May 2018, after her mother parked her 1998 Honda Civic on a street in East Hollywood.
“It’s hard to park in my neighborhood, so she left it a few blocks away from my apartment, just south of Hollywood Boulevard,” Reyes said. “When my mom went back to get it, for a while I just thought she couldn’t find it. But she went ahead and put in a police report.”
A little while later, Reyes and her mother got a call from the California Highway Patrol.
“What happened is someone had stolen it, and then they got into a chase with the police and they crashed the car,” Reyes recounted. “Then it got towed out to a place in Alhambra where I paid a fee for them to destroy it.”
Reyes was less surprised that her car was stolen than she was about how her insurance company reacted.
“My insurance didn’t cover anything,” Reyes said. “Even with them having caught someone, it was just a total loss for me. There was no compensation at all.”
While Reyes was able to pay for a new car, she was shocked by how little effort there was to help her after the incident.
“If you have a car you’re relying on to get to work or school, and that disappears without having any safety net around it at all, it’s a big deal,” Reyes said. “I definitely got better insurance this time around.”
How we did it: We examined LAPD publicly available data on reports of vehicle thefts (criminal code 510) and attempted vehicle thefts (criminal code 520) for 2019, which revealed a decrease in incidents from the same time period last year.
For neighborhood boundaries, we rely on the borders defined by the Los Angeles Times. Learn more about our data here.
LAPD data only reflect crimes that are reported to the department, not how many crimes actually occurred. In making our calculations, we rely on the data the LAPD makes publicly available. On occasion, LAPD may update past crime reports with new information, or recategorize past reports. Those revised reports do not always automatically become part of the public database.
Want to know how your neighborhood fares? Or simply just interested in our data? Email us at askus@xtown.la.


