

LA property crime: sharpest drop in a decade


Reported incidents of property crime fell last year by 7%, according to Los Angeles Police Department data, the sharpest drop for the City of Los Angeles in a decade.
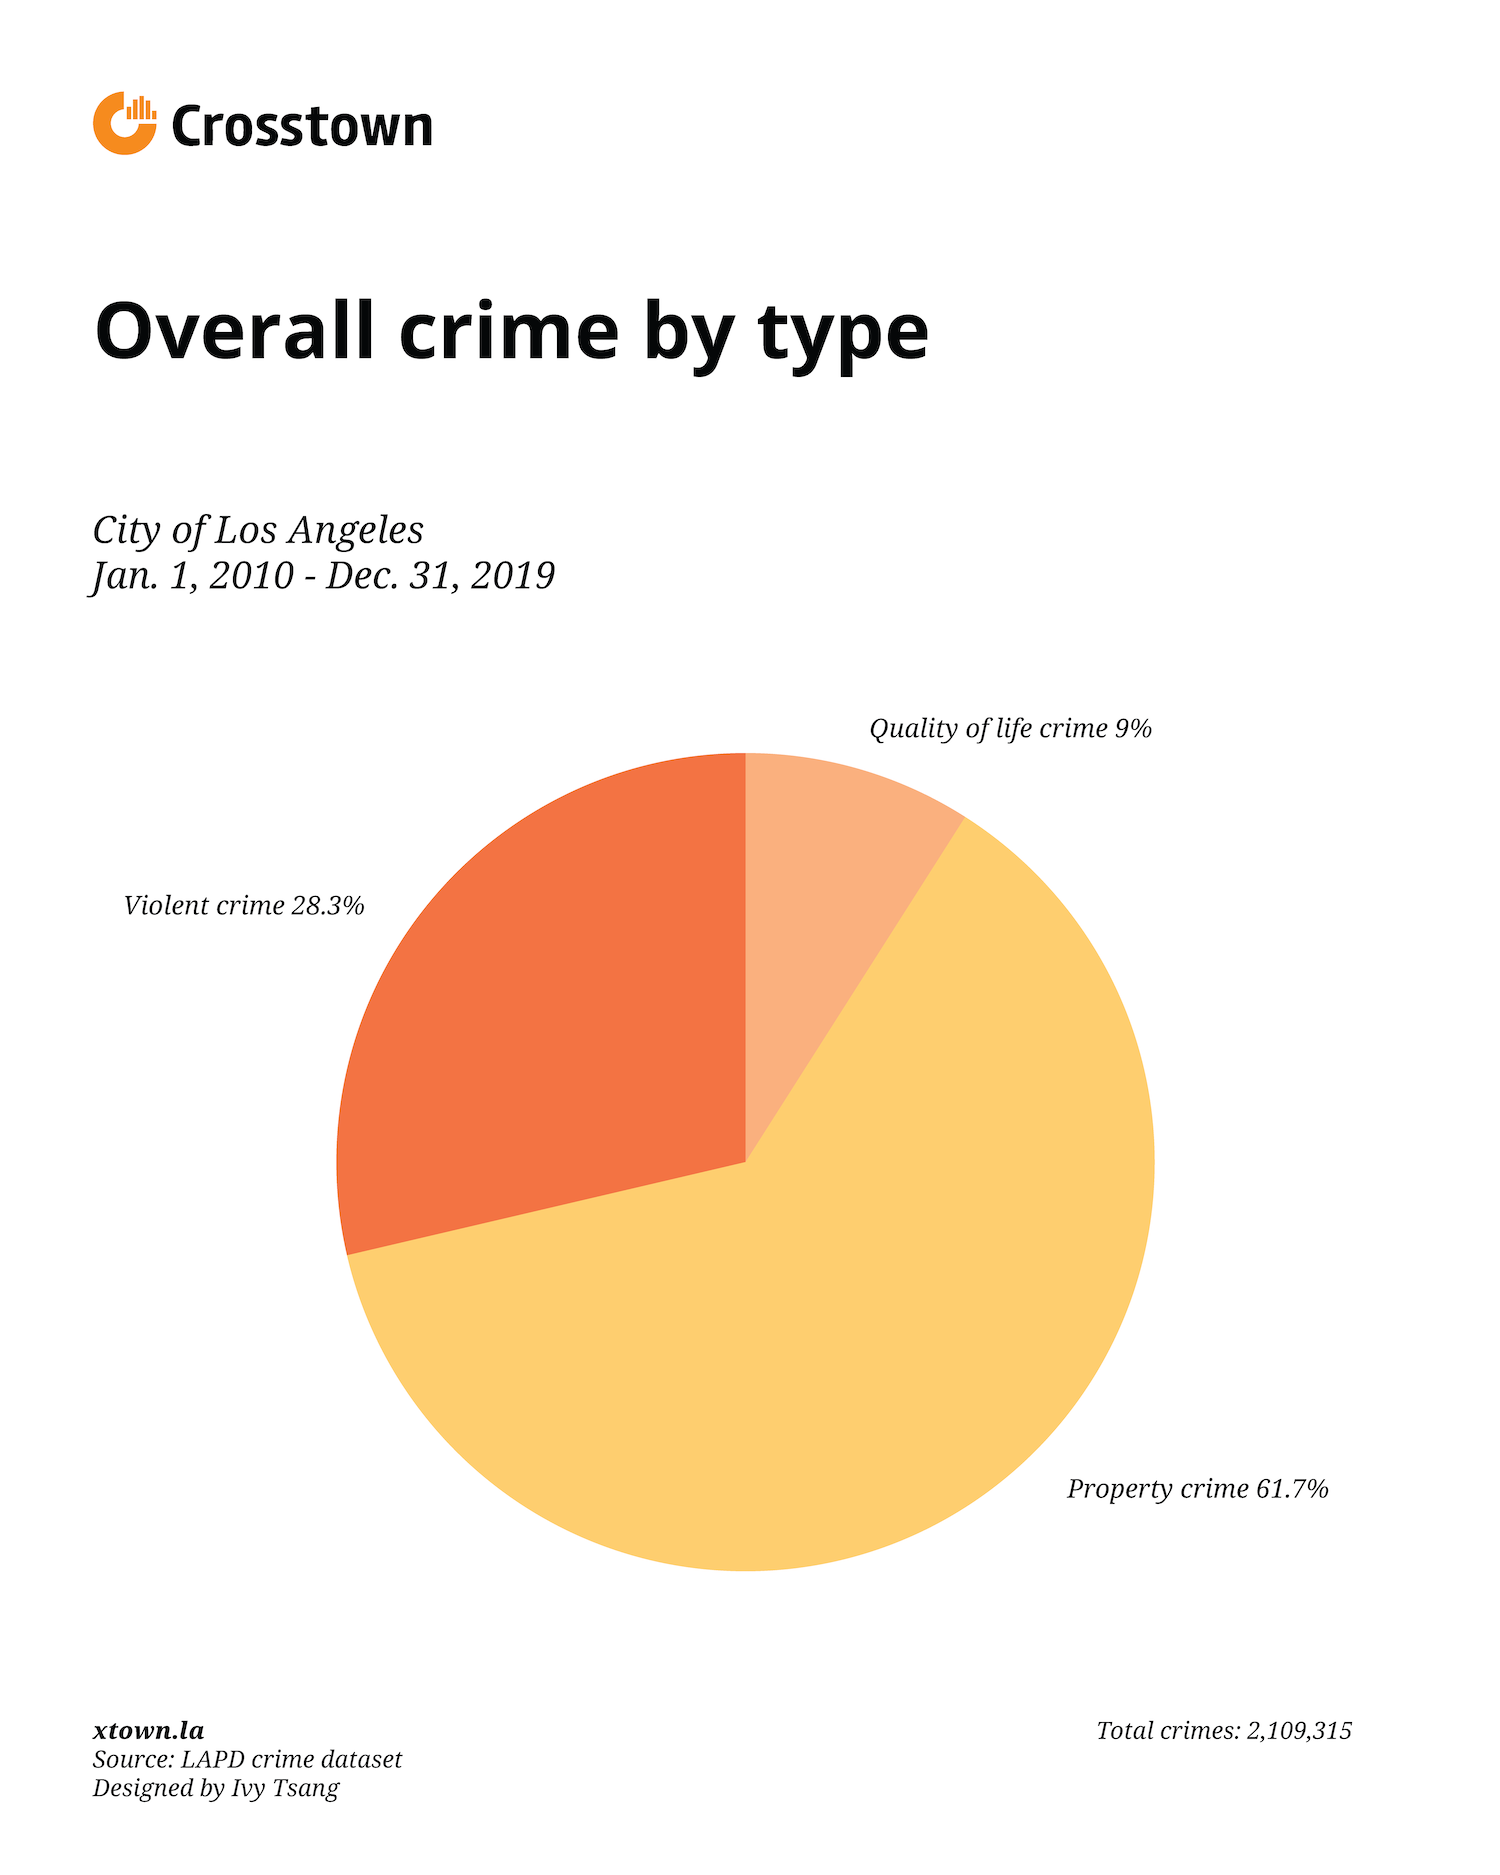
This crime includes any offense, attempted or committed, involving theft or damage of property. Property offenses include arson, vehicle theft, burglary and vandalism.
The majority of crimes committed in LA during the past decade were property offenses.
Last year was the second consecutive year that property crime decreased, part of a broader trend of falling crime in LA since 2017.

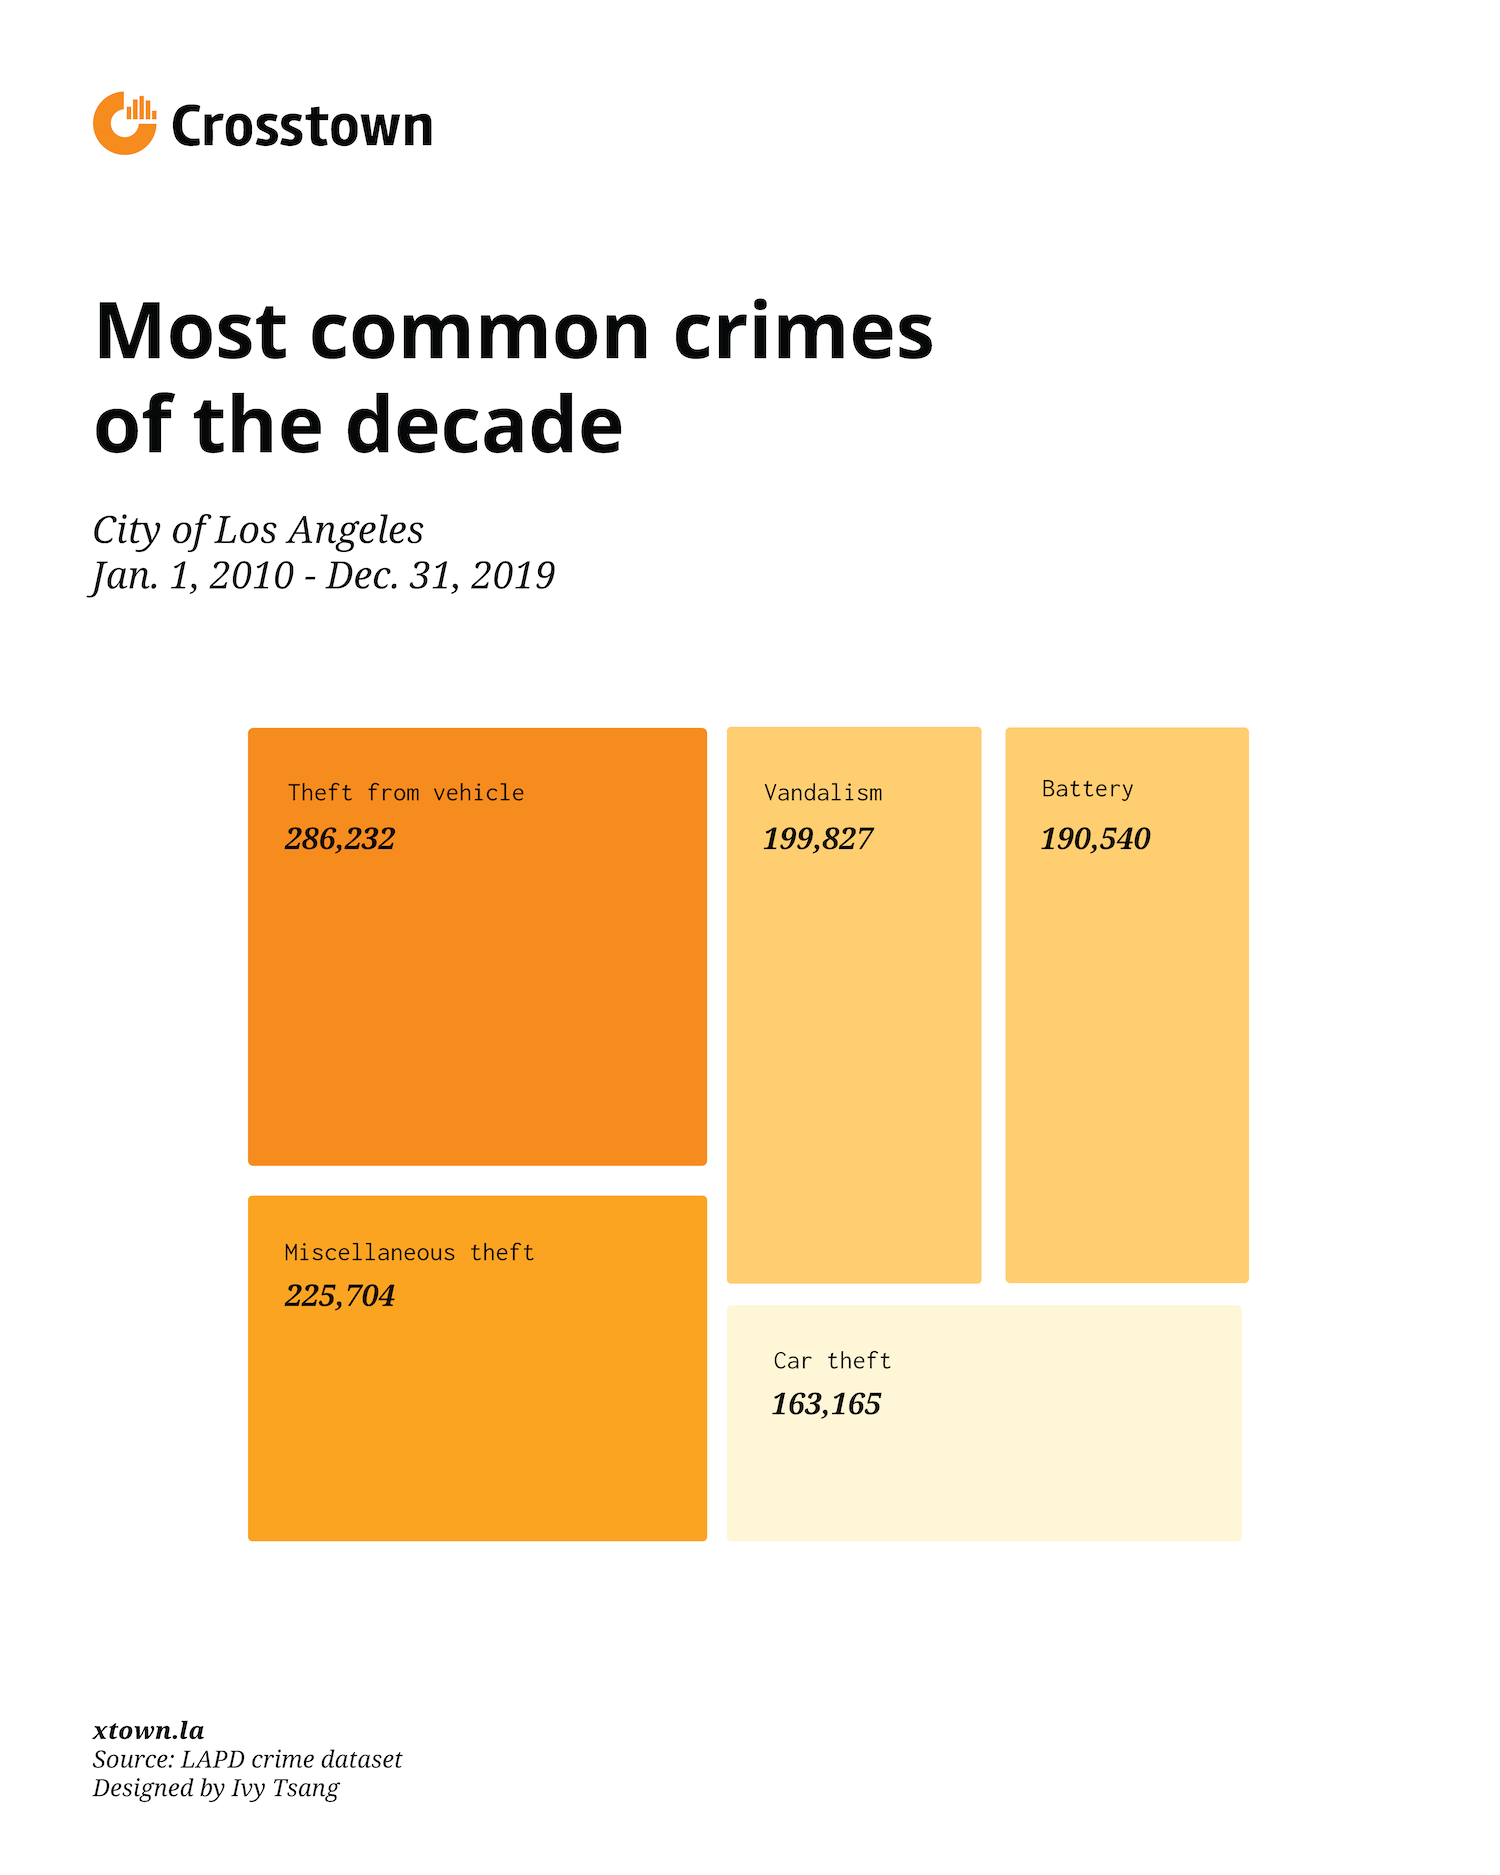
Four out of the top five crimes committed in the city over the past decade were property offenses. Battery was the only violent crime to make the top five.
Downtown had far and above the highest rate of property crimes per resident in 2019. For every 100,000 residents, there were 16,005 property crimes committed in this neighborhood.
Crime rates in Downtown are often skewed because it’s one of LA’s busiest neighborhoods, and attracts a large number of workers, diners and shoppers everyday.
Next in line was Fairfax, a neighborhood in west Los Angeles which has seen an explosion in shopping and commercial activity recently. For every 100,000 residents, there were almost 8,610 property crimes.
Arleta, a residential neighborhood at the northern edge of the city, had the lowest rate of property crimes. For every 100,000 residents, 1,421 offenses were committed.
Of the 110 LA neighborhoods that we track, 93 experienced a decrease in their property crime rate from 2018 to 2019. Only 16 saw an increase during the same time period.
Elysian Valley, the neighborhood adjacent to Dodger Stadium, experienced the sharpest rise last year in its property crime rate, at 28%.
Bel Air, another wealthy neighborhood on the Westside, had the steepest drop, at 28%.
The Westside neighborhood of Beverly Grove experienced no change in its property crime rate.
Click on the arrows in the table to sort by category. Click once to see the category in ascending order, and again to see it in descending order. Use the search bar to find your neighborhood. (The number column refers to alphabetical order.)
| Neighborhood | Prop. crimes 2010-2019 | Prop. crime 2019 | Prop. crime 2018 | total population | Prop. crime rate (2019) | Prop. crime rate (2018) | % change (2019-18) |
| Adams-Normandie | 5147 | 504 | 542 | 17925 | 2812 | 3024 | -7% |
| Arleta | 6196 | 480 | 548 | 33780 | 1421 | 1622 | -12% |
| Arlington Heights | 5372 | 530 | 643 | 23768 | 2230 | 2705 | -18% |
| Atwater Village | 4030 | 371 | 405 | 11206 | 3311 | 3614 | -8% |
| Baldwin Hills/Crenshaw | 17683 | 1426 | 1822 | 29672 | 4806 | 6140 | -22% |
| Bel Air | 1469 | 128 | 179 | 7615 | 1681 | 2351 | -28% |
| Beverly Crest | 2113 | 206 | 213 | 11266 | 1829 | 1891 | -3% |
| Beverly Grove | 11810 | 1,541 | 1543 | 22023 | 6997 | 7006 | 0% |
| Beverlywood | 1132 | 148 | 141 | 7244 | 2043 | 1946 | 5% |
| Boyle Heights | 25574 | 2,786 | 2933 | 92036 | 3027 | 3187 | -5% |
| Brentwood | 8869 | 805 | 945 | 32865 | 2449 | 2875 | -15% |
| Broadway-Manchester | 12427 | 1241 | 1338 | 28280 | 4388 | 4731 | -7% |
| Canoga Park | 24278 | 2394 | 2565 | 59641 | 4014 | 4301 | -7% |
| Carthay | 1999 | 185 | 195 | 5356 | 3454 | 3641 | -5% |
| Central Alameda | 9536 | 922 | 995 | 43129 | 2138 | 2307 | -7% |
| Century City | 3868 | 405 | 398 | 6175 | 6559 | 6445 | 2% |
| Chatsworth | 13064 | 1202 | 1323 | 50435 | 2383 | 2623 | -9% |
| Chesterfield Square | 3216 | 318 | 358 | 8247 | 3856 | 4341 | -11% |
| Cheviot Hills | 2139 | 223 | 278 | 8747 | 2549 | 3178 | -20% |
| Chinatown | 3304 | 574 | 466 | 13687 | 4194 | 3405 | 23% |
| Cypress Park | 2867 | 301 | 279 | 9786 | 3076 | 2851 | 8% |
| Del Rey | 7643 | 784 | 767 | 30010 | 2612 | 2556 | 2% |
| Downtown | 58939 | 8016 | 7953 | 50085 | 16005 | 15879 | 1% |
| Eagle Rock | 8982 | 717 | 801 | 34233 | 2094 | 2340 | -10% |
| East Hollywood | 18452 | 1753 | 1942 | 68503 | 2559 | 2835 | -10% |
| Echo Park | 10893 | 1270 | 1134 | 34950 | 3634 | 3245 | 12% |
| El Sereno | 8183 | 667 | 758 | 42077 | 1585 | 1801 | -12% |
| Elysian Park | 1120 | 118 | 140 | 2386 | 4946 | 5868 | -16% |
| Elysian Valley | 1446 | 231 | 180 | 7404 | 3120 | 2431 | 28% |
| Encino | 13945 | 1286 | 1527 | 45712 | 2813 | 3340 | -16% |
| Exposition Park | 13066 | 1273 | 1331 | 35235 | 3613 | 3777 | -4% |
| Fairfax | 9702 | 1161 | 1245 | 13484 | 8610 | 9233 | -7% |
| Florence | 18784 | 1766 | 1959 | 52639 | 3355 | 3722 | -10% |
| Glassell Park | 5518 | 580 | 647 | 24084 | 2408 | 2686 | -10% |
| Gramercy Park | 4247 | 401 | 410 | 10666 | 3760 | 3844 | -2% |
| Granada Hills | 16247 | 1337 | 1479 | 53296 | 2509 | 2775 | -10% |
| Green Meadows | 12037 | 1123 | 1370 | 34848 | 3223 | 3931 | -18% |
| Hancock Park | 4691 | 472 | 542 | 10774 | 4381 | 5031 | -13% |
| Harbor City | 6337 | 535 | 681 | 25833 | 2071 | 2636 | -21% |
| Harbor Gateway | 11668 | 1258 | 1228 | 41308 | 3045 | 2973 | 2% |
| Harvard Heights | 5935 | 615 | 661 | 19497 | 3154 | 3390 | -7% |
| Harvard Park | 5639 | 491 | 540 | 9423 | 5211 | 5731 | -9% |
| Highland Park | 11484 | 888 | 1093 | 53013 | 1675 | 2062 | -19% |
| Historic South Central | 17138 | 1789 | 1720 | 48700 | 3674 | 3532 | 4% |
| Hollywood | 40573 | 4488 | 4898 | 73119 | 6138 | 6699 | -8% |
| Hollywood Hills | 9128 | 960 | 1004 | 21296 | 4508 | 4715 | -4% |
| Hollywood Hills West | 4837 | 509 | 534 | 15965 | 3188 | 3345 | -5% |
| Hyde Park | 13876 | 1134 | 1393 | 35461 | 3198 | 3928 | -19% |
| Jefferson Park | 6634 | 652 | 735 | 25339 | 2573 | 2901 | -11% |
| Koreatown | 31086 | 3307 | 3625 | 107316 | 3082 | 3378 | -9% |
| Lake Balboa | 6652 | 586 | 663 | 27115 | 2161 | 2445 | -12% |
| Lakeview Terrace | 2818 | 225 | 312 | 13579 | 1657 | 2298 | -28% |
| Larchmont | 2496 | 241 | 286 | 8595 | 2804 | 3328 | -16% |
| Leimert Park | 6249 | 550 | 687 | 12566 | 4377 | 5467 | -20% |
| Lincoln Heights | 7103 | 811 | 820 | 28649 | 2831 | 2862 | -1% |
| Los Feliz | 11555 | 1111 | 1209 | 33492 | 3317 | 3610 | -8% |
| Manchester Square | 5005 | 492 | 497 | 11516 | 4272 | 4316 | -1% |
| Mar Vista | 7745 | 840 | 814 | 37833 | 2220 | 2152 | 3% |
| Mid-City | 15510 | 1691 | 1626 | 51962 | 3254 | 3129 | 4% |
| Mid-Wilshire | 14588 | 1591 | 1668 | 42682 | 3728 | 3908 | -5% |
| Mission Hills | 5930 | 543 | 629 | 18747 | 2896 | 3355 | -14% |
| Montecito Heights | 3124 | 293 | 315 | 17724 | 1653 | 1777 | -7% |
| Mount Washington | 2578 | 219 | 259 | 14201 | 1542 | 1824 | -15% |
| North Hills | 15750 | 1333 | 1601 | 62414 | 2136 | 2565 | -17% |
| North Hollywood | 30275 | 2812 | 3159 | 81849 | 3436 | 3860 | -11% |
| Northridge | 23742 | 2159 | 2300 | 67555 | 3196 | 3405 | -6% |
| Pacific Palisades | 5099 | 462 | 504 | 24990 | 1849 | 2017 | -8% |
| Pacoima | 17962 | 1608 | 1709 | 76726 | 2096 | 2227 | -6% |
| Palms | 11060 | 1076 | 1129 | 42746 | 2517 | 2641 | -5% |
| Panorama City | 19930 | 1721 | 1921 | 70212 | 2451 | 2736 | -10% |
| Pico-Robertson | 5520 | 538 | 604 | 18307 | 2939 | 3299 | -11% |
| Pico-Union | 12204 | 1354 | 1376 | 42187 | 3210 | 3262 | -2% |
| Playa Del Rey | 3227 | 308 | 289 | 11434 | 2694 | 2528 | 7% |
| Playa Vista | 3252 | 418 | 404 | 11126 | 3757 | 3631 | 3% |
| Porter Ranch | 5908 | 443 | 553 | 26040 | 1701 | 2124 | -20% |
| Rancho Park | 1660 | 158 | 201 | 5531 | 2857 | 3634 | -21% |
| Reseda | 18199 | 1584 | 1722 | 71569 | 2213 | 2406 | -8% |
| San Pedro | 26160 | 1978 | 2208 | 80601 | 2454 | 2739 | -10% |
| Sawtelle | 13720 | 1624 | 1771 | 42223 | 3846 | 4194 | -8% |
| Shadow Hills | 3562 | 315 | 390 | 12999 | 2423 | 3000 | -19% |
| Sherman Oaks | 24732 | 2316 | 2616 | 71575 | 3236 | 3655 | -11% |
| Silver Lake | 11350 | 1215 | 1242 | 31189 | 3896 | 3982 | -2% |
| South Park | 9834 | 1023 | 1061 | 33339 | 3068 | 3182 | -4% |
| Studio City | 16873 | 1682 | 1879 | 39851 | 4221 | 4715 | -10% |
| Sun Valley | 22660 | 2146 | 2326 | 71743 | 2991 | 3242 | -8% |
| Sunland | 4049 | 326 | 391 | 14614 | 2231 | 2676 | -17% |
| Sylmar | 18688 | 1505 | 1577 | 80327 | 1874 | 1963 | -5% |
| Tarzana | 11827 | 1164 | 1330 | 37739 | 3084 | 3524 | -12% |
| Toluca Lake | 3189 | 276 | 347 | 9192 | 3003 | 3775 | -20% |
| Tujunga | 6242 | 498 | 604 | 27328 | 1822 | 2210 | -18% |
| University Park | 11833 | 1394 | 1318 | 24170 | 5767 | 5453 | 6% |
| Valley Glen | 20602 | 1721 | 1934 | 58495 | 2942 | 3306 | -11% |
| Valley Village | 9086 | 804 | 888 | 25746 | 3123 | 3449 | -9% |
| Van Nuys | 37306 | 3571 | 4028 | 111635 | 3199 | 3608 | -11% |
| Venice | 19431 | 2062 | 2198 | 34048 | 6056 | 6456 | -6% |
| Vermont Slauson | 12130 | 1102 | 1201 | 21634 | 5094 | 5551 | -8% |
| Vermont Square | 16690 | 1619 | 1710 | 26836 | 6033 | 6372 | -5% |
| Vermont Vista | 9513 | 965 | 1084 | 49385 | 1954 | 2195 | -11% |
| Vermont-Knolls | 9670 | 930 | 1079 | 24031 | 3870 | 4490 | -14% |
| Watts | 12910 | 1203 | 1254 | 44939 | 2677 | 2790 | -4% |
| West Adams | 6629 | 712 | 693 | 21328 | 3338 | 3249 | 3% |
| West Hills | 10534 | 973 | 1108 | 39299 | 2476 | 2819 | -12% |
| West Los Angeles | 5727 | 431 | 575 | 12888 | 3344 | 4462 | -25% |
| Westchester | 26414 | 2787 | 2855 | 41193 | 6766 | 6931 | -2% |
| Westlake | 30608 | 3162 | 3397 | 107760 | 2934 | 3152 | -7% |
| Westwood | 9553 | 1009 | 1020 | 53050 | 1902 | 1923 | -1% |
| Wilmington | 16182 | 1426 | 1641 | 58161 | 2452 | 2821 | -13% |
| Windsor Square | 2219 | 246 | 302 | 6694 | 3675 | 4512 | -19% |
| Winnetka | 13082 | 1123 | 1255 | 53895 | 2084 | 2329 | -11% |
| Woodland Hills | 23476 | 2330 | 2510 | 67139 | 3470 | 3739 | -7% |
How we did it: We examined LAPD data on reported property crimes since Jan. 1, 2010, when the LAPD started making its crime data publicly available. For neighborhood boundaries, we rely on the borders defined by the Los Angeles Times. Learn more about our data here.
LAPD data only reflects crimes that are reported to the department, not how many crimes actually occurred. In making our calculations, we rely on the data the LAPD makes publicly available. On occasion, LAPD may update past crime reports with new information, or recategorize past reports. Those revised reports do not always automatically become part of the public database.
Want to know how your neighborhood fares? Or simply just interested in our data? Email us at askus@xtown.la.


