

Violent crime falls for second straight year in LA


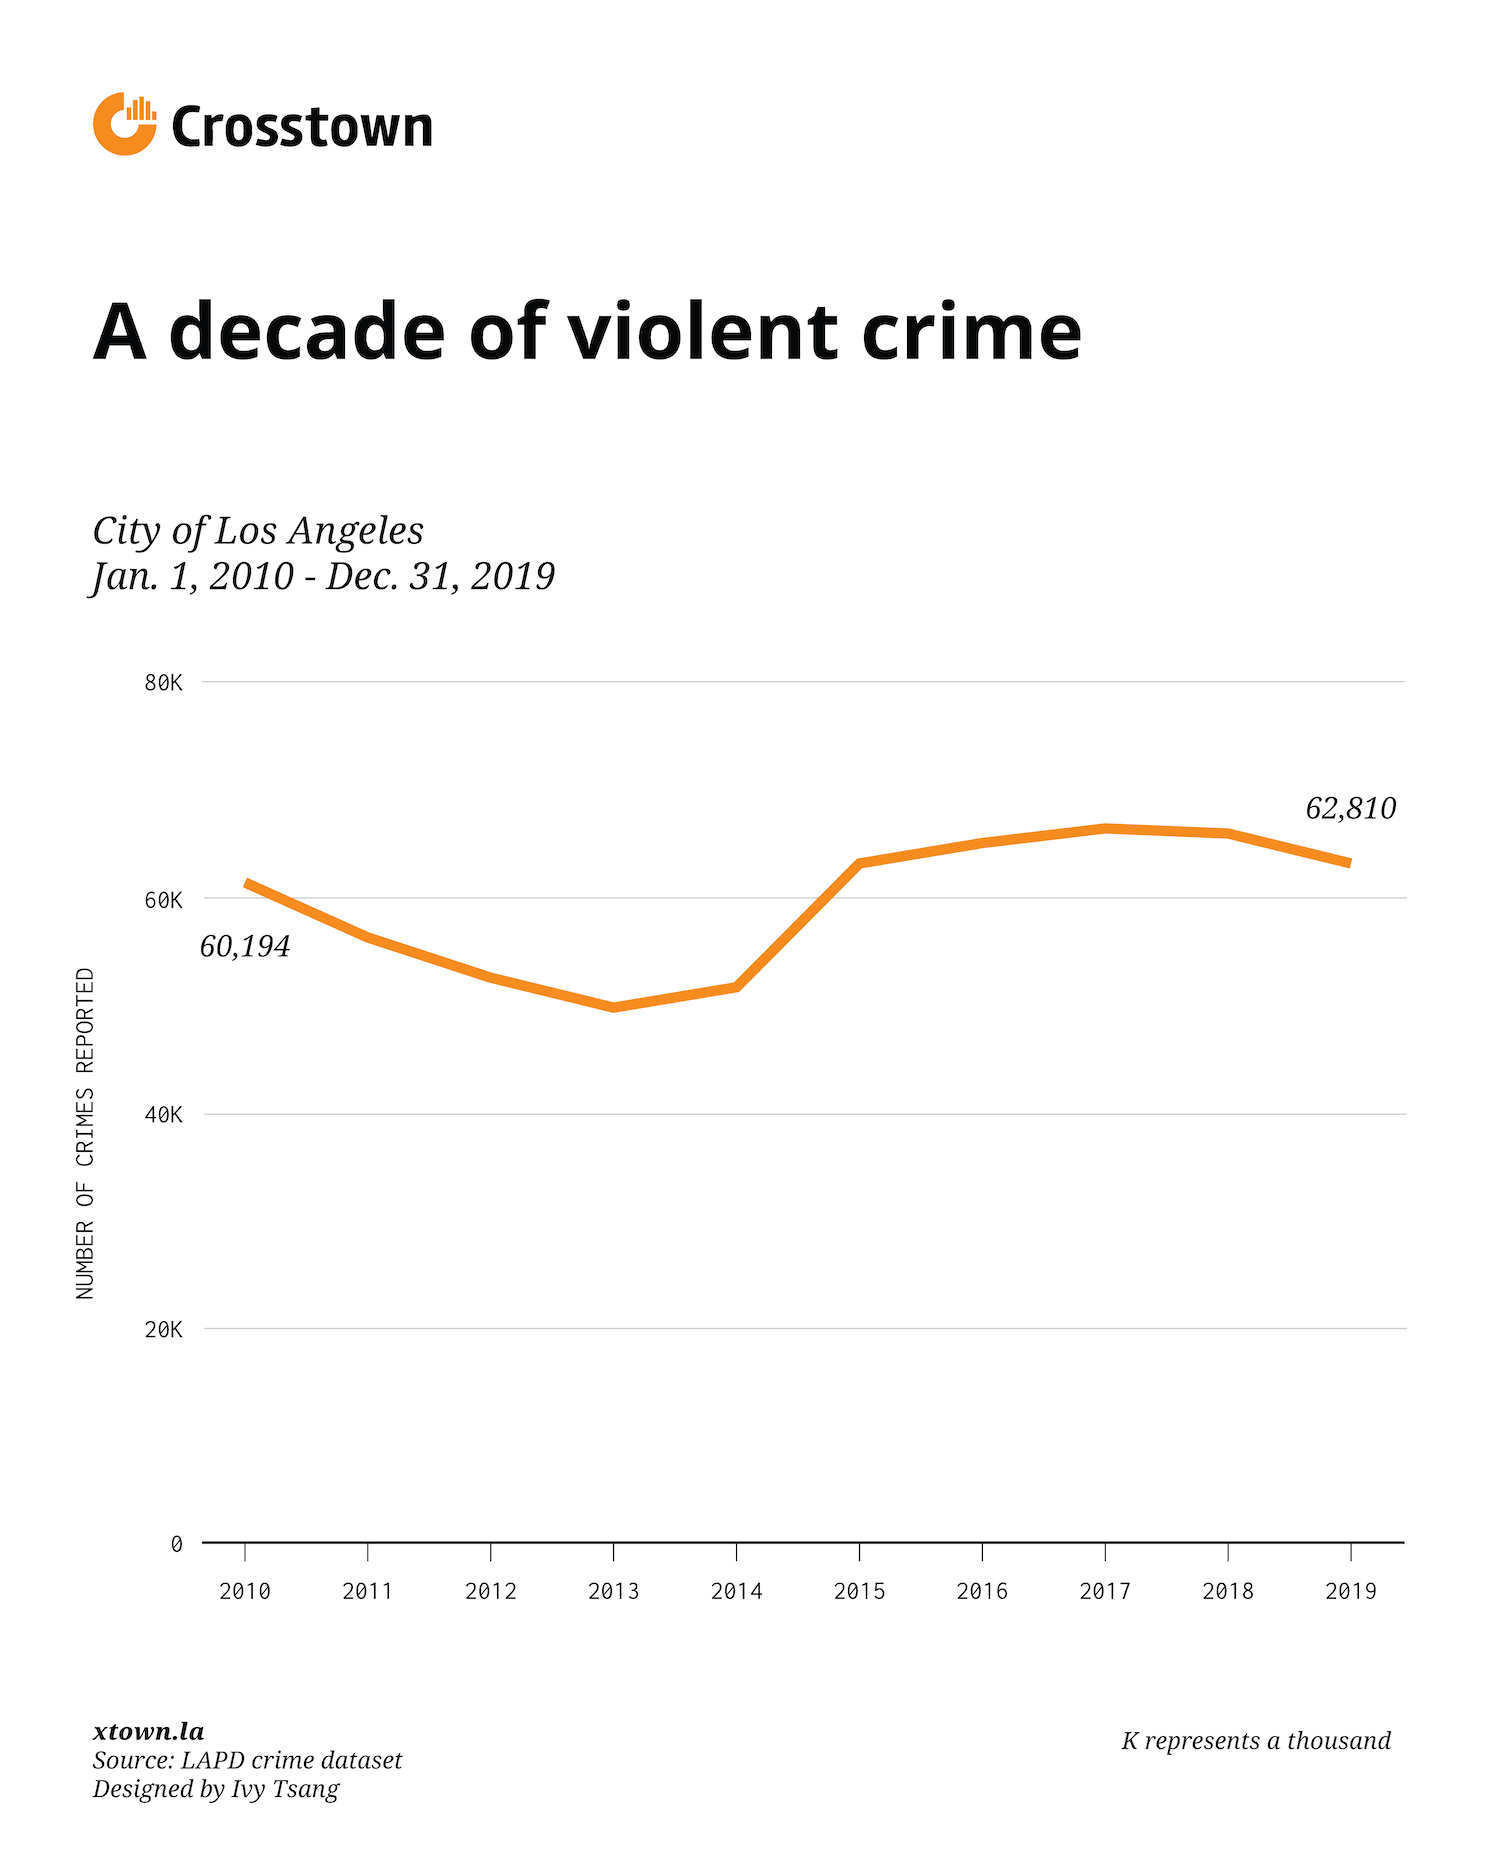
Violent crime in the City of Los Angeles fell for the second straight year, dropping 3.6% from 2018 to 2019, according to Los Angeles Police Department data. This decrease parallels a drop in overall crime in LA, which started in 2017.
Yet these types of crimes rose 4.3% over the past decade, with 62,810 reported incidents in 2019, compared to 60,194 in 2010.
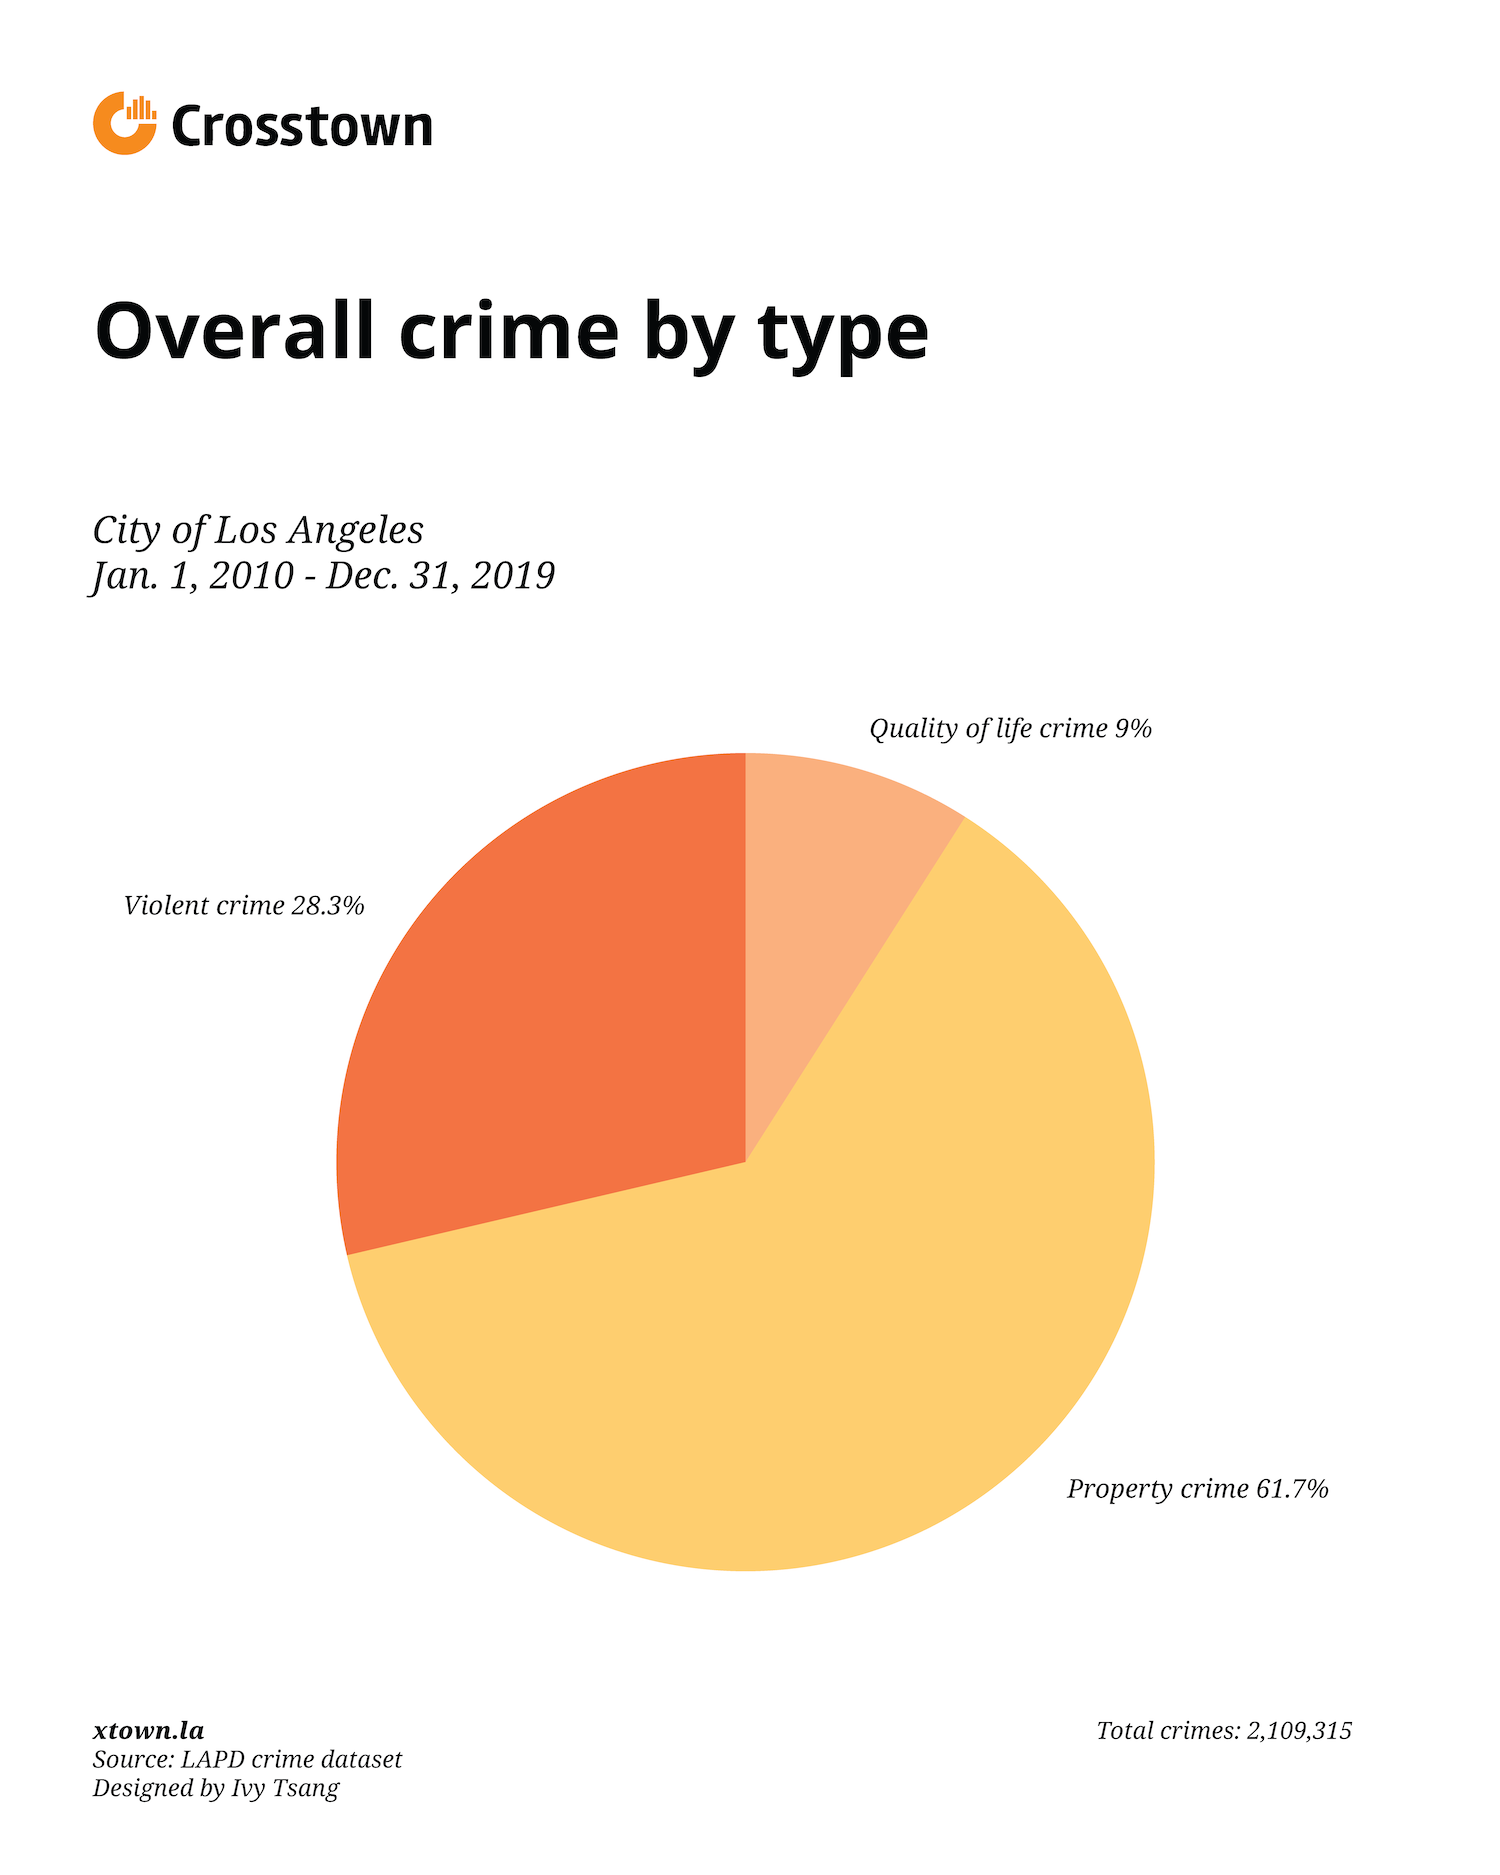
Violent crime, ranging from simple and aggravated assault to kidnapping, made up almost 30% of the 2.1 million total crimes reported to the LAPD in the last decade.
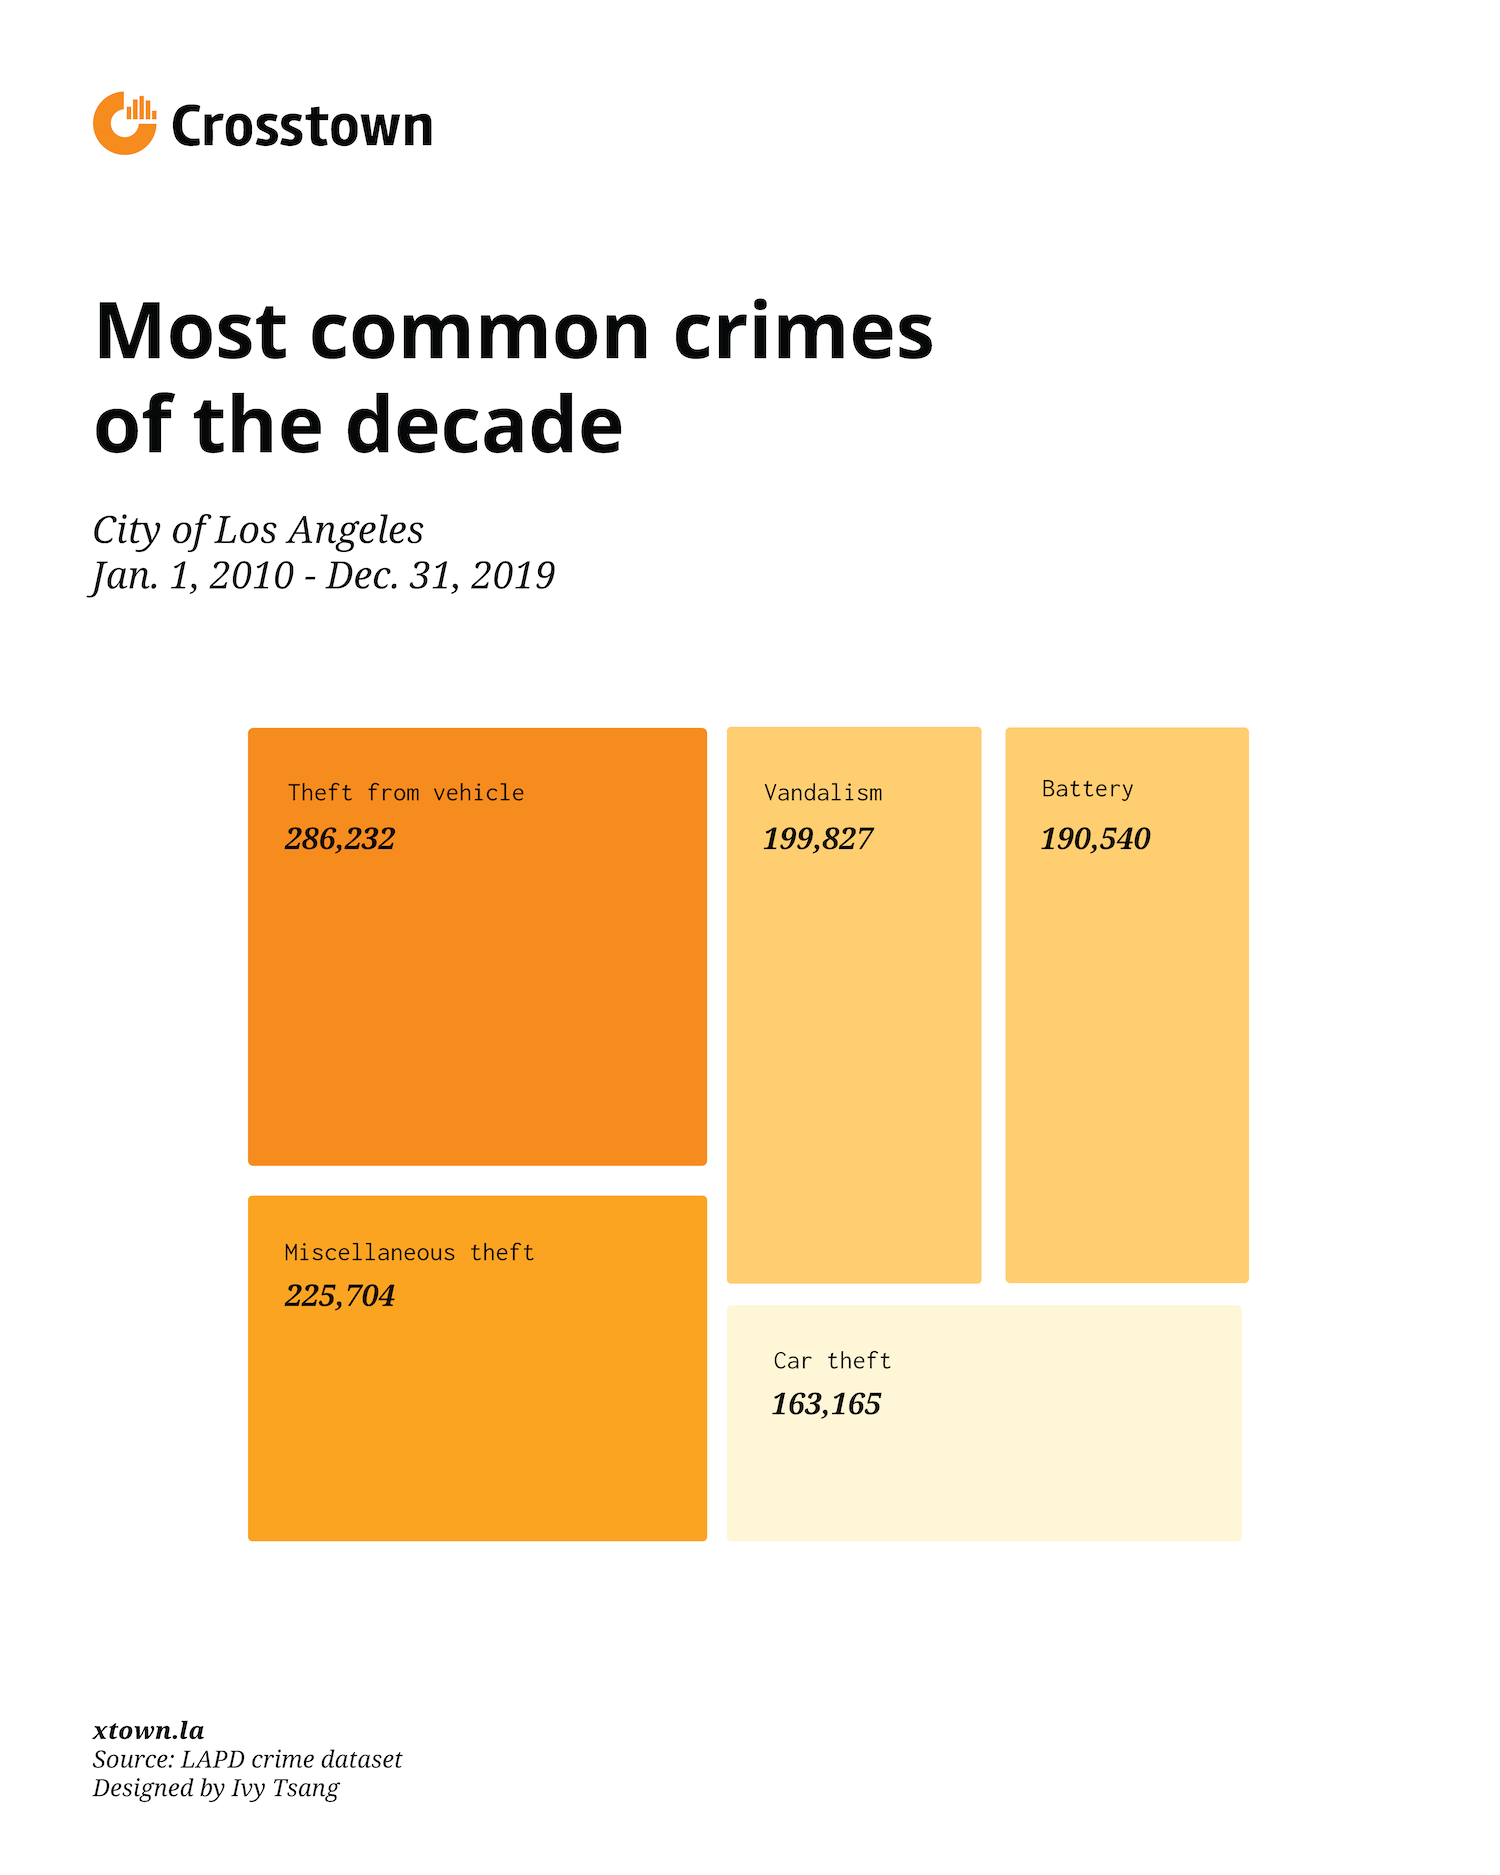
Battery was LA’s most commonly reported violent offense from 2010 to 2019.
Seventy-two neighborhoods saw a decrease in their violent crime rate — or the number of crimes committed per 100,000 people — from 2018 to 2019. Elysian Valley, adjacent to Dodger Stadium, had the largest decrease in violent crime, with its rate falling by 28%.
The neighborhood with the highest increase was Carthay — a West LA neighborhood of a half-square mile — at 52%. Hollywood Hills West had the second highest increase — at 34%.
Violent crime can have long lasting and devastating effects on individuals. Besides physical suffering, the effects of violence on victims include mental health issues and reduced quality of life.
Over the past decade, the California Victim Compensation Board received nearly 55,000 claims from survivors looking for help with expenses resulting from violent crimes. The state-run organization was established in 1965 to cover expenses ranging from mental health services to income loss to crime scene clean-up and funeral and burial expenses.
Click on the arrows in the table to sort by category. Click once to see the category in ascending order, and again to see it in descending order. Use the search bar to find your neighborhood. (The number column refers to alphabetical order.)
| Neighborhood | Violent crime rate 2010-2019 | Violent crime rate 2019 | Violent crime rate 2018 | Total population | Violent crime rate (2019) | Violent crime rate (2018) | Change (2019-18) |
| Adams-Normandie | 3333 | 339 | 333 | 17925 | 1891 | 1858 | 2% |
| Arleta | 2464 | 214 | 206 | 33780 | 634 | 610 | 4% |
| Arlington Heights | 3363 | 328 | 386 | 23768 | 1380 | 1624 | -15% |
| Atwater Village | 1181 | 106 | 115 | 11206 | 946 | 1026 | -8% |
| Baldwin Hills/Crenshaw | 8999 | 782 | 931 | 29672 | 2635 | 3138 | -16% |
| Bel-Air | 251 | 28 | 23 | 7615 | 368 | 302 | 22% |
| Beverly Crest | 469 | 62 | 64 | 11266 | 550 | 568 | -3% |
| Beverly Grove | 2367 | 357 | 333 | 22023 | 1621 | 1512 | 7% |
| Beverlywood | 317 | 31 | 28 | 7244 | 428 | 387 | 11% |
| Boyle Heights | 15611 | 1,691 | 1822 | 92036 | 1837 | 1980 | -7% |
| Brentwood | 1422 | 146 | 182 | 32865 | 444 | 554 | -20% |
| Broadway-Manchester | 10622 | 1132 | 1137 | 28280 | 4003 | 4021 | 0% |
| Canoga Park | 8860 | 916 | 998 | 59641 | 1536 | 1673 | -8% |
| Carthay | 632 | 91 | 60 | 5356 | 1699 | 1120 | 52% |
| Central Alameda | 7094 | 729 | 720 | 43129 | 1690 | 1669 | 1% |
| Century City | 534 | 58 | 60 | 6175 | 939 | 972 | -3% |
| Chatsworth | 3639 | 419 | 432 | 50435 | 831 | 857 | -3% |
| Chesterfield Square | 2462 | 282 | 317 | 8247 | 3419 | 3844 | -11% |
| Cheviot Hills | 528 | 73 | 84 | 8747 | 835 | 960 | -13% |
| Chinatown | 1407 | 175 | 178 | 13687 | 1279 | 1301 | -2% |
| Cypress Park | 1666 | 173 | 168 | 9786 | 1768 | 1717 | 3% |
| Del Rey | 2246 | 200 | 220 | 30010 | 666 | 733 | -9% |
| Downtown | 37718 | 5145 | 5030 | 50085 | 10273 | 10043 | 2% |
| Eagle Rock | 2310 | 193 | 254 | 34233 | 564 | 742 | -24% |
| East Hollywood | 11060 | 1040 | 1135 | 68503 | 1518 | 1657 | -8% |
| Echo Park | 4231 | 404 | 410 | 34950 | 1156 | 1173 | -1% |
| El Sereno | 4335 | 376 | 485 | 42077 | 894 | 1153 | -22% |
| Elysian Park | 626 | 95 | 84 | 2386 | 3982 | 3521 | 13% |
| Elysian Valley | 455 | 39 | 54 | 7404 | 527 | 729 | -28% |
| Encino | 2744 | 312 | 325 | 45712 | 683 | 711 | -4% |
| Exposition Park | 10274 | 1088 | 1038 | 35235 | 3088 | 2946 | 5% |
| Fairfax | 2429 | 322 | 347 | 13484 | 2388 | 2573 | -7% |
| Florence | 15757 | 1566 | 1581 | 52639 | 2975 | 3003 | -1% |
| Glassell Park | 2071 | 212 | 250 | 24084 | 880 | 1038 | -15% |
| Gramercy Park | 2593 | 252 | 261 | 10666 | 2363 | 2447 | -3% |
| Granada Hills | 4202 | 400 | 392 | 53296 | 751 | 736 | 2% |
| Green Meadows | 9783 | 1062 | 1029 | 34848 | 3048 | 2953 | 3% |
| Hancock Park | 961 | 110 | 105 | 10774 | 1021 | 975 | 5% |
| Harbor City | 2738 | 307 | 299 | 25833 | 1188 | 1157 | 3% |
| Harbor Gateway | 4529 | 588 | 500 | 41308 | 1423 | 1210 | 18% |
| Harvard Heights | 3789 | 382 | 451 | 19497 | 1959 | 2313 | -15% |
| Harvard Park | 3562 | 368 | 374 | 9423 | 3905 | 3969 | -2% |
| Highland Park | 6460 | 563 | 602 | 53013 | 1062 | 1136 | -6% |
| Historic South Central | 12563 | 1423 | 1351 | 48700 | 2922 | 2774 | 5% |
| Hollywood | 20764 | 2410 | 2429 | 73119 | 3296 | 3322 | -1% |
| Hollywood Hills | 2070 | 238 | 221 | 21296 | 1118 | 1038 | 8% |
| Hollywood Hills West | 1109 | 150 | 112 | 15965 | 940 | 702 | 34% |
| Hyde Park | 10596 | 933 | 1026 | 35461 | 2631 | 2893 | -9% |
| Jefferson Park | 4370 | 391 | 431 | 25339 | 1543 | 1701 | -9% |
| Koreatown | 17208 | 1705 | 1882 | 107316 | 1589 | 1754 | -9% |
| Lake Balboa | 2189 | 232 | 270 | 27115 | 856 | 996 | -14% |
| Lakeview Terrace | 1328 | 109 | 146 | 13579 | 803 | 1075 | -25% |
| Larchmont | 610 | 64 | 65 | 8595 | 745 | 756 | -2% |
| Leimert Park | 3520 | 343 | 365 | 12566 | 2730 | 2905 | -6% |
| Lincoln Heights | 4025 | 427 | 465 | 28649 | 1490 | 1623 | -8% |
| Los Feliz | 2584 | 228 | 287 | 33492 | 681 | 857 | -21% |
| Manchester Square | 3542 | 367 | 364 | 11516 | 3187 | 3161 | 1% |
| Mar Vista | 1727 | 180 | 176 | 37833 | 476 | 465 | 2% |
| Mid-City | 7740 | 742 | 870 | 51962 | 1428 | 1674 | -15% |
| Mid-Wilshire | 4336 | 485 | 523 | 42682 | 1136 | 1225 | -7% |
| Mission Hills | 2017 | 221 | 243 | 18747 | 1179 | 1296 | -9% |
| Montecito Heights | 1322 | 167 | 131 | 17724 | 942 | 739 | 27% |
| Mount Washington | 642 | 64 | 61 | 14201 | 451 | 430 | 5% |
| North Hills | 8117 | 756 | 847 | 62414 | 1211 | 1357 | -11% |
| North Hollywood | 12039 | 1245 | 1305 | 81849 | 1521 | 1594 | -5% |
| Northridge | 6491 | 656 | 727 | 67555 | 971 | 1076 | -10% |
| Pacific Palisades | 1023 | 92 | 102 | 24990 | 368 | 408 | -10% |
| Pacoima | 10084 | 931 | 1057 | 76726 | 1213 | 1378 | -12% |
| Palms | 2714 | 293 | 290 | 42746 | 685 | 678 | 1% |
| Panorama City | 9893 | 835 | 988 | 70212 | 1189 | 1407 | -15% |
| Pico-Robertson | 1382 | 161 | 169 | 18307 | 879 | 923 | -5% |
| Pico-Union | 9250 | 955 | 944 | 42187 | 2264 | 2238 | 1% |
| Playa Del Rey | 653 | 83 | 64 | 11434 | 726 | 560 | 30% |
| Playa Vista | 495 | 59 | 60 | 11126 | 530 | 539 | -2% |
| Porter Ranch | 911 | 97 | 99 | 26040 | 373 | 380 | -2% |
| Rancho Park | 296 | 24 | 31 | 5531 | 434 | 560 | -23% |
| Reseda | 7334 | 726 | 764 | 71569 | 1014 | 1068 | -5% |
| San Pedro | 10942 | 1151 | 1229 | 80601 | 1428 | 1525 | -6% |
| Sawtelle | 3337 | 399 | 403 | 42223 | 945 | 954 | -1% |
| Shadow Hills | 844 | 99 | 93 | 12999 | 762 | 715 | 6% |
| Sherman Oaks | 4827 | 413 | 497 | 71575 | 577 | 694 | -17% |
| Silver Lake | 2555 | 244 | 285 | 31189 | 782 | 914 | -14% |
| South Park | 7946 | 783 | 851 | 33339 | 2349 | 2553 | -8% |
| Studio City | 3237 | 352 | 441 | 39851 | 883 | 1107 | -20% |
| Sun Valley | 9332 | 993 | 964 | 71743 | 1384 | 1344 | 3% |
| Sunland | 1254 | 115 | 119 | 14614 | 787 | 814 | -3% |
| Sylmar | 7798 | 743 | 722 | 80327 | 925 | 899 | 3% |
| Tarzana | 3163 | 355 | 341 | 37739 | 941 | 904 | 4% |
| Toluca Lake | 621 | 60 | 72 | 9192 | 653 | 783 | -17% |
| Tujunga | 1761 | 174 | 154 | 27328 | 637 | 564 | 13% |
| University Park | 2822 | 327 | 355 | 24170 | 1353 | 1469 | -8% |
| Valley Glen | 7152 | 682 | 707 | 58495 | 1166 | 1209 | -4% |
| Valley Village | 1976 | 171 | 217 | 25746 | 664 | 843 | -21% |
| Van Nuys | 17762 | 1824 | 1829 | 111635 | 1634 | 1638 | 0% |
| Venice | 6825 | 761 | 803 | 34048 | 2235 | 2358 | -5% |
| Vermont Knolls | 8242 | 879 | 899 | 24031 | 3658 | 3741 | -2% |
| Vermont Slauson | 10080 | 1104 | 1098 | 21634 | 5103 | 5075 | 1% |
| Vermont Square | 13735 | 1318 | 1396 | 26836 | 4911 | 5202 | -6% |
| Vermont Vista | 8017 | 862 | 852 | 49385 | 1745 | 1725 | 1% |
| Watts | 12204 | 1195 | 1225 | 44939 | 2659 | 2726 | -2% |
| West Adams | 4247 | 433 | 405 | 21328 | 2030 | 1899 | 7% |
| West Hills | 2458 | 252 | 321 | 39299 | 641 | 817 | -21% |
| West Los Angeles | 910 | 109 | 117 | 12888 | 846 | 908 | -7% |
| Westchester | 4910 | 625 | 636 | 41193 | 1517 | 1544 | -2% |
| Westlake | 24459 | 2612 | 2521 | 107760 | 2424 | 2339 | 4% |
| Westwood | 2224 | 242 | 273 | 53050 | 456 | 515 | -11% |
| Wilmington | 8530 | 974 | 890 | 58161 | 1675 | 1530 | 9% |
| Windsor Square | 403 | 46 | 48 | 6694 | 687 | 717 | -4% |
| Winnetka | 5219 | 469 | 584 | 53895 | 870 | 1084 | -20% |
| Woodland Hills | 5235 | 537 | 605 | 67139 | 800 | 901 | -11% |
How we did it: We examined LAPD publicly available data on reports of violent crime from Jan. 1, 2010 – Dec. 31, 2019. For neighborhood boundaries, we rely on the borders defined by the Los Angeles Times. Learn more about our data here.
LAPD data only reflect crimes that are reported to the department, not how many crimes actually occurred. In making our calculations, we rely on the data the LAPD makes publicly available. On occasion, LAPD may update past crime reports with new information, or recategorize past reports. Those revised reports do not always automatically become part of the public database.
Want to know how your neighborhood fares? Or simply just interested in our data? Email us at askus@xtown.la.


