

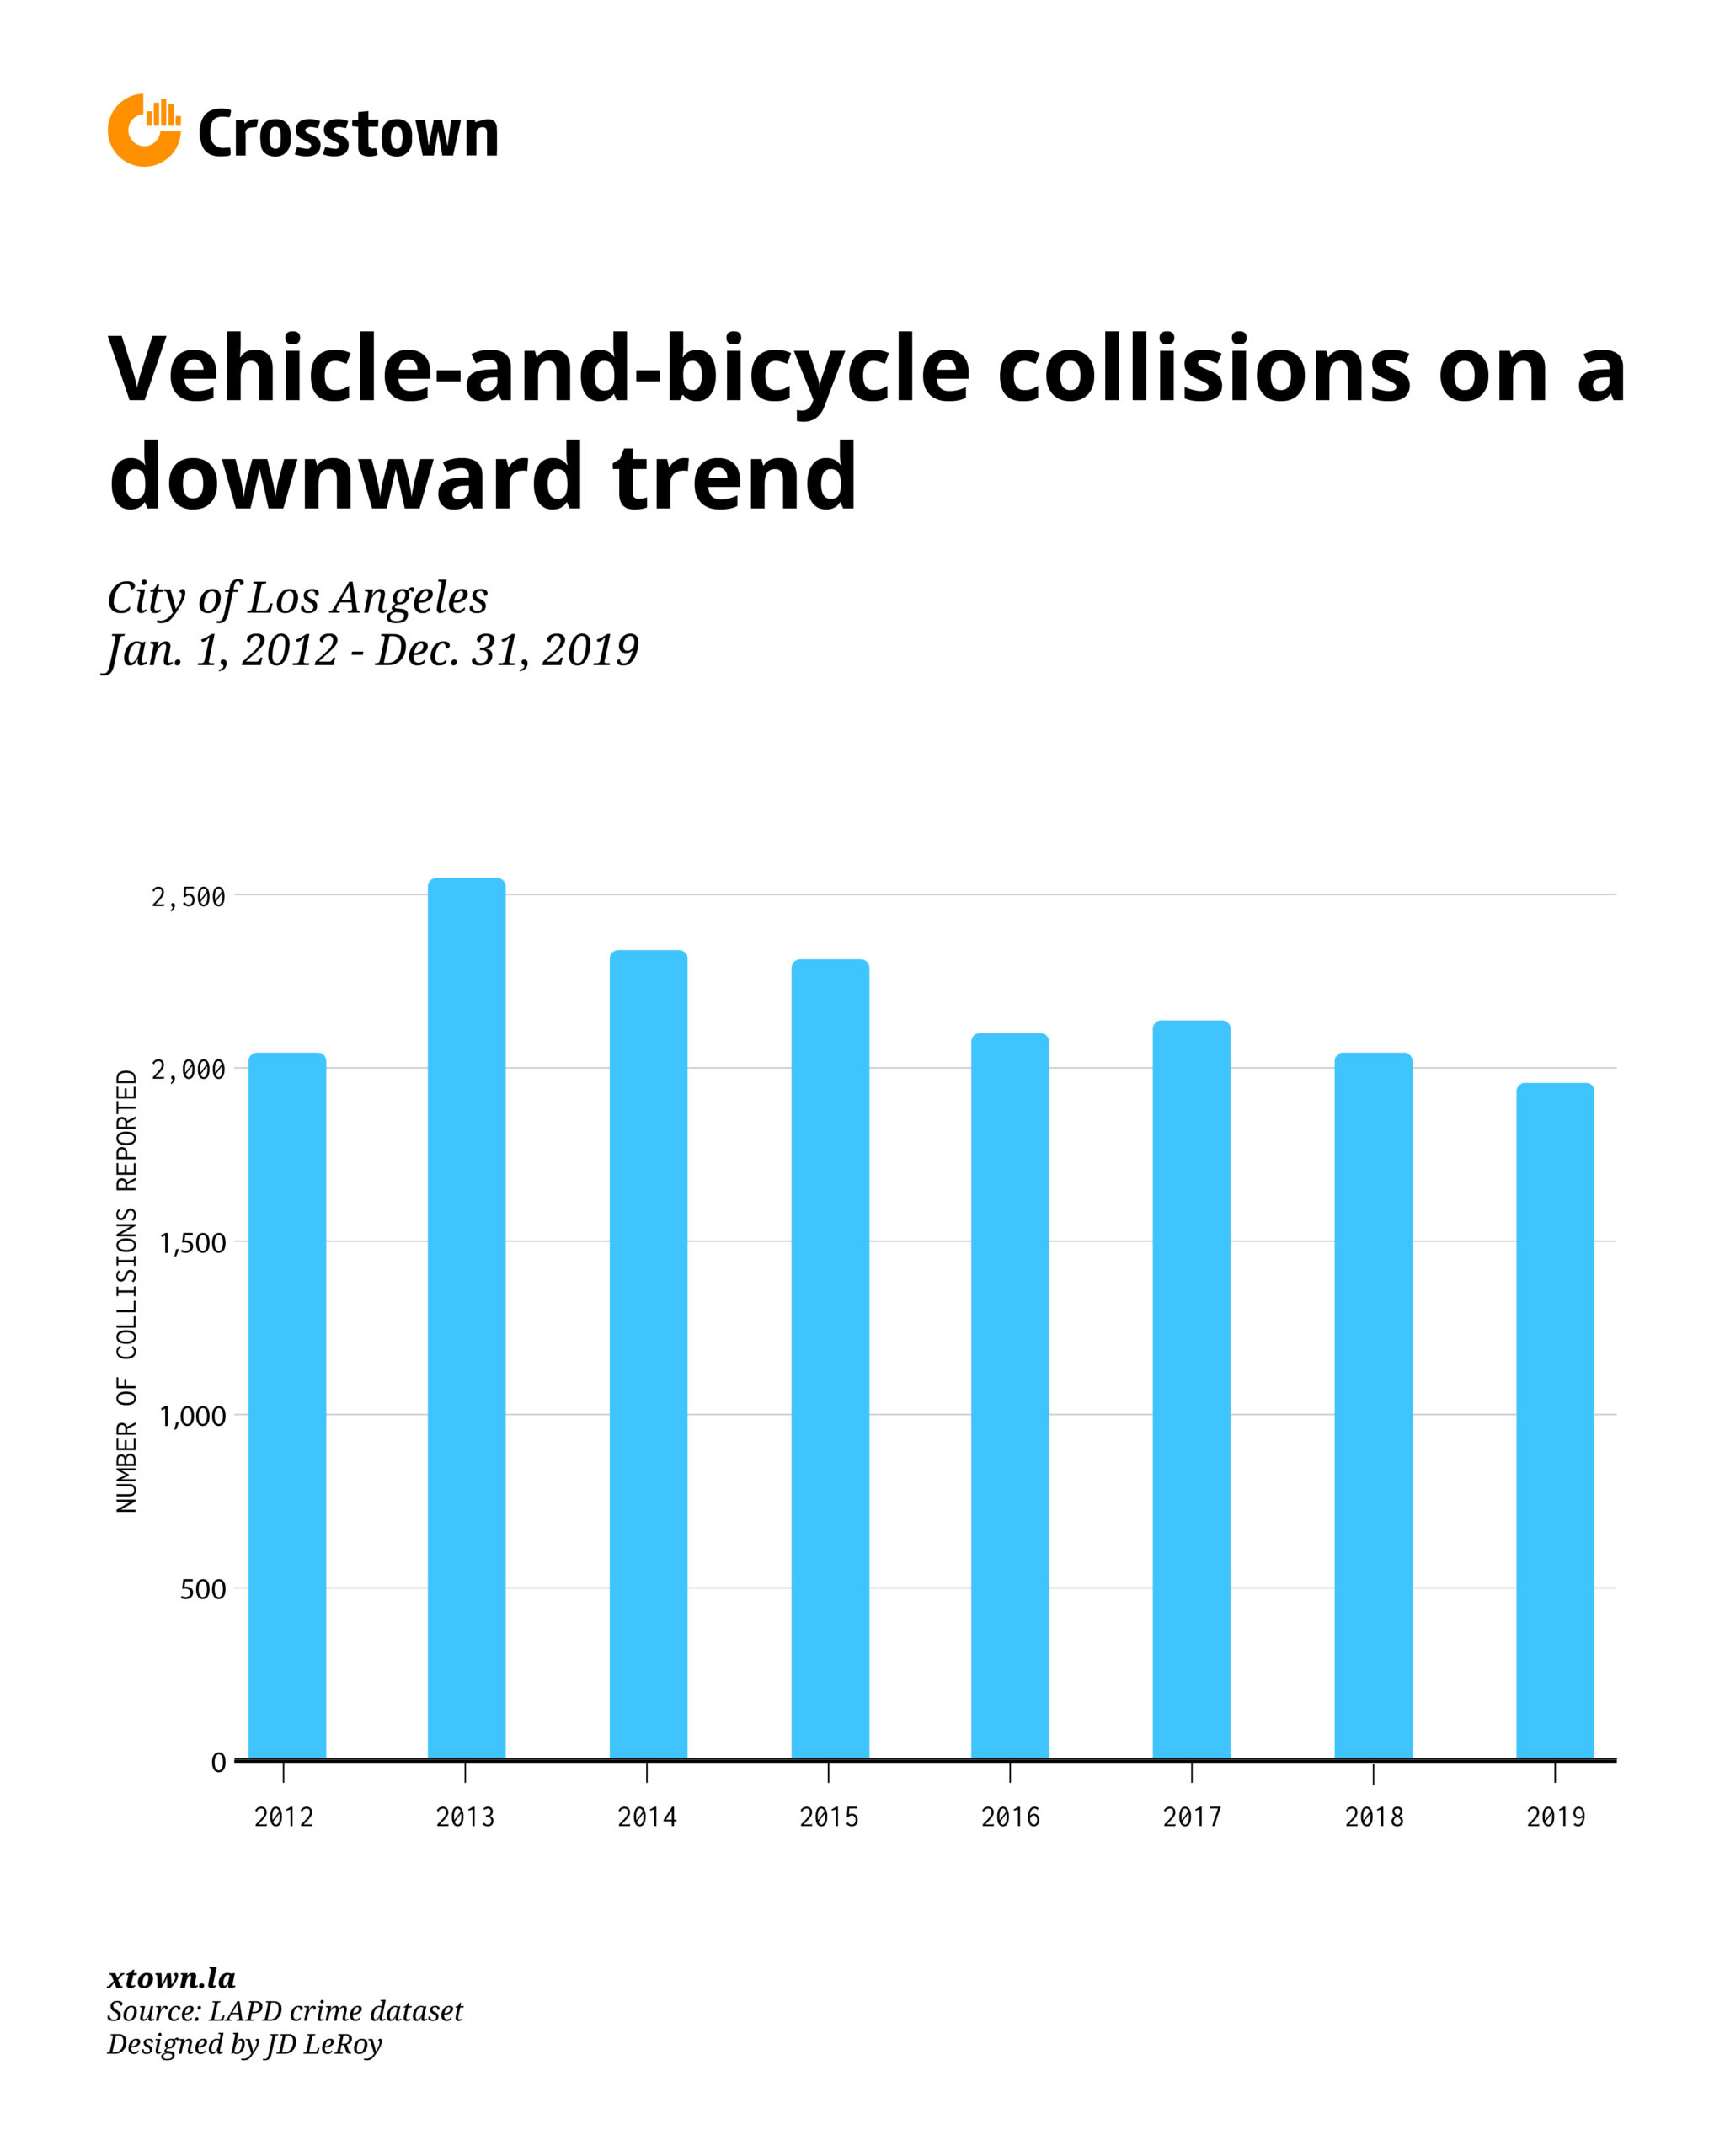
LA makes modest progress on bike crashes


Biking in Los Angeles traffic has never been easy, but there are signs that it is getting a little bit safer: Collisions involving bicycles and vehicles decreased 5% between 2018 to 2019, according to Los Angeles Police Department data.
Last year’s drop to 1,953 vehicle-and-bicycle collisions is the lowest in the last seven years. This number, however, includes 18 fatal collisions. That’s a slight drop from the 20 fatalities a year earlier.
However, for bike safety activists, the number of deaths remains far too high. Several months ago, activists staged a die-in at LA City Hall, with protestors lying on the ground to represent the number of people killed in traffic collisions, bringing attention to a lack of progress made on the city’s Vision Zero plan to eliminate traffic deaths by 2025.
In 2019, I was riding my bike on the sidewalk near the intersection of Vermont Ave. and 36th Pl. in LA’s Exposition Park neighborhood when a driver exited a parking lot, did not yield and hit me, leaving me with a broken collarbone on the hood of his Toyota Corolla.
Los Angeles has fought a long — though not always effective — battle to make the city safer for cyclists. Lt. David Ferry of the LAPD’s Traffic Division said a key part in that fight has been the reengineering of many miles of bike lanes as part of the Vision Zero program.
That, as well as efforts to slow down vehicle speeds on city roads, he said, might have contributed to last year’s decline in vehicle-and-bicycle collisions.
The Los Angeles Department of Transportation has created more than 1,172 miles of bike lanes over the last few decades, said spokesperson Nora Frost.
Five of the top 10 neighborhoods for vehicle-and-bicycle collisions saw decreases in those rates last year. The largest drop was in the coastal neighborhood of Venice, a 13% decline.
But not all neighborhoods are seeing fewer vehicle-and-bicycle collisions. Van Nuys, home to the most dangerous intersection in LA, saw a 22% increase in vehicle-and-bicycle collisions, the highest in the city.
The greatest number of collisions involving vehicles and bicycles happened in Downtown, one of the most densely populated and congested neighborhoods in LA, with 210 collisions. The neighborhood saw a 1% increase in collisions involving cyclists last year.

Mar Vista had 25 collisions involving vehicles and bicycles in 2018 but cut those numbers nearly in half last year. LADOT’s Frost said this decrease was the result of adding protected and buffered bike lanes, which are separated from car lanes by a physical barrier or a painted buffer space, as well as crosswalks and pedestrian interval signals at various points on Venice Blvd. between Beethoven St. and Inglewood Blvd.
The department is also adding protected bike lanes on Main St. and Spring St. in Downtown.
“It’s the kind of infrastructure we’d like to see more of throughout the city, and it’s going to be the game-changer to get more people to ride bikes,” said Colin Bogart, the education director for the Los Angeles County Bicycle Coalition, a bicycle safety advocacy group. “People want to ride in a lane that feels safe.”
Bogart said that some LA City Council members have not been supportive in adding cycling infrastructure.
“Gil Cedillo of Council District 1 has been very much against implementing any bike infrastructure and has said no to everything proposed in his district,” Bogart said.
Conrad TerrazasCross, Cedillo’s communications director, said the Councilmember has — on the contrary — supported projects like adding more protections to existing bike lanes along Eagle Rock Boulevard.
“Public safety for pedestrians, motorists and cyclists has always been a priority for the Councilmember,” said TerrazasCross.
Bogart complained that District 12 Councilmember John Lee asked LADOT to study a protected bike lane on Reseda Blvd., which was constructed in 2015, and which Bogart thinks should remain.
Grace Yao, communications director for Lee, said the study was already supposed to happen six months after the 2015 construction to see how effective it was.
“It’s been over four years,” she said. “We need some hard data to see if [the bike lane] was successful.”
There is a lot that individual drivers and cyclists can do to ensure their safety.
Cyclists are afforded the same rights and responsibilities as motor vehicles, according to the California Vehicle Code.
The LA County Bicycle Coalition partners with the LA Metro on Bicycle Education Safety Training rides for people who are new to cycling. For those who do not have time for the training ride, the coalition offers a smart pocket guide detailing the rules of the road for cyclists.
How we did it: We examined LAPD publicly available data on traffic collisions involving vehicles and bicycles since 2012. For neighborhood boundaries, we rely on the borders defined by the Los Angeles Times. Learn more about our data here.
LAPD data only reflect collisions that are reported to the department, not how many collisions actually occurred. In making our calculations, we rely on the data the LAPD makes publicly available. On occasion, LAPD may update past collision reports with new information, or recategorize past reports. Those revised reports do not always automatically become part of the public database.
Want to know how your neighborhood fares? Or simply just interested in our data? Email us at askus@xtown.la.


