

Learning curve: Yawning gaps in school funding across LA County


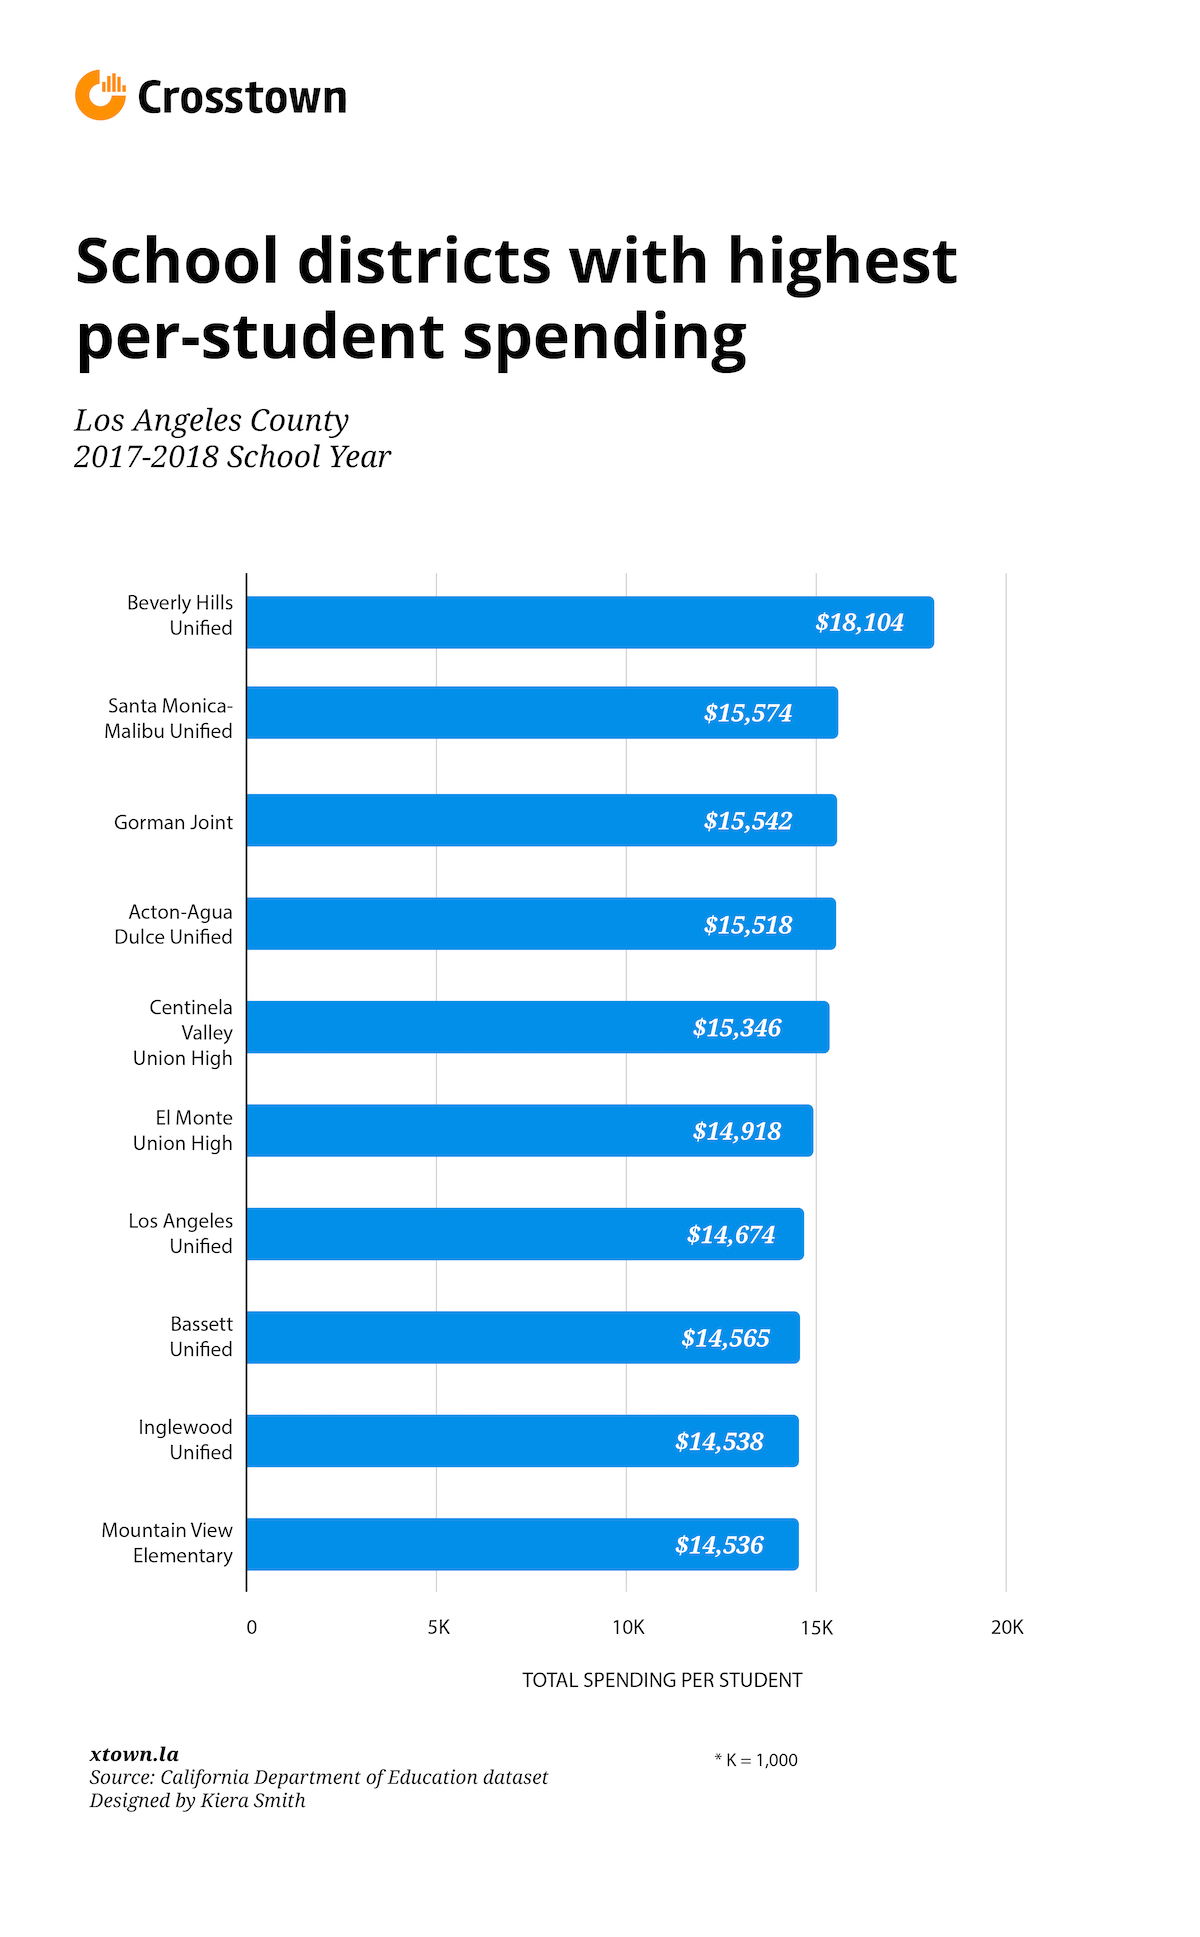
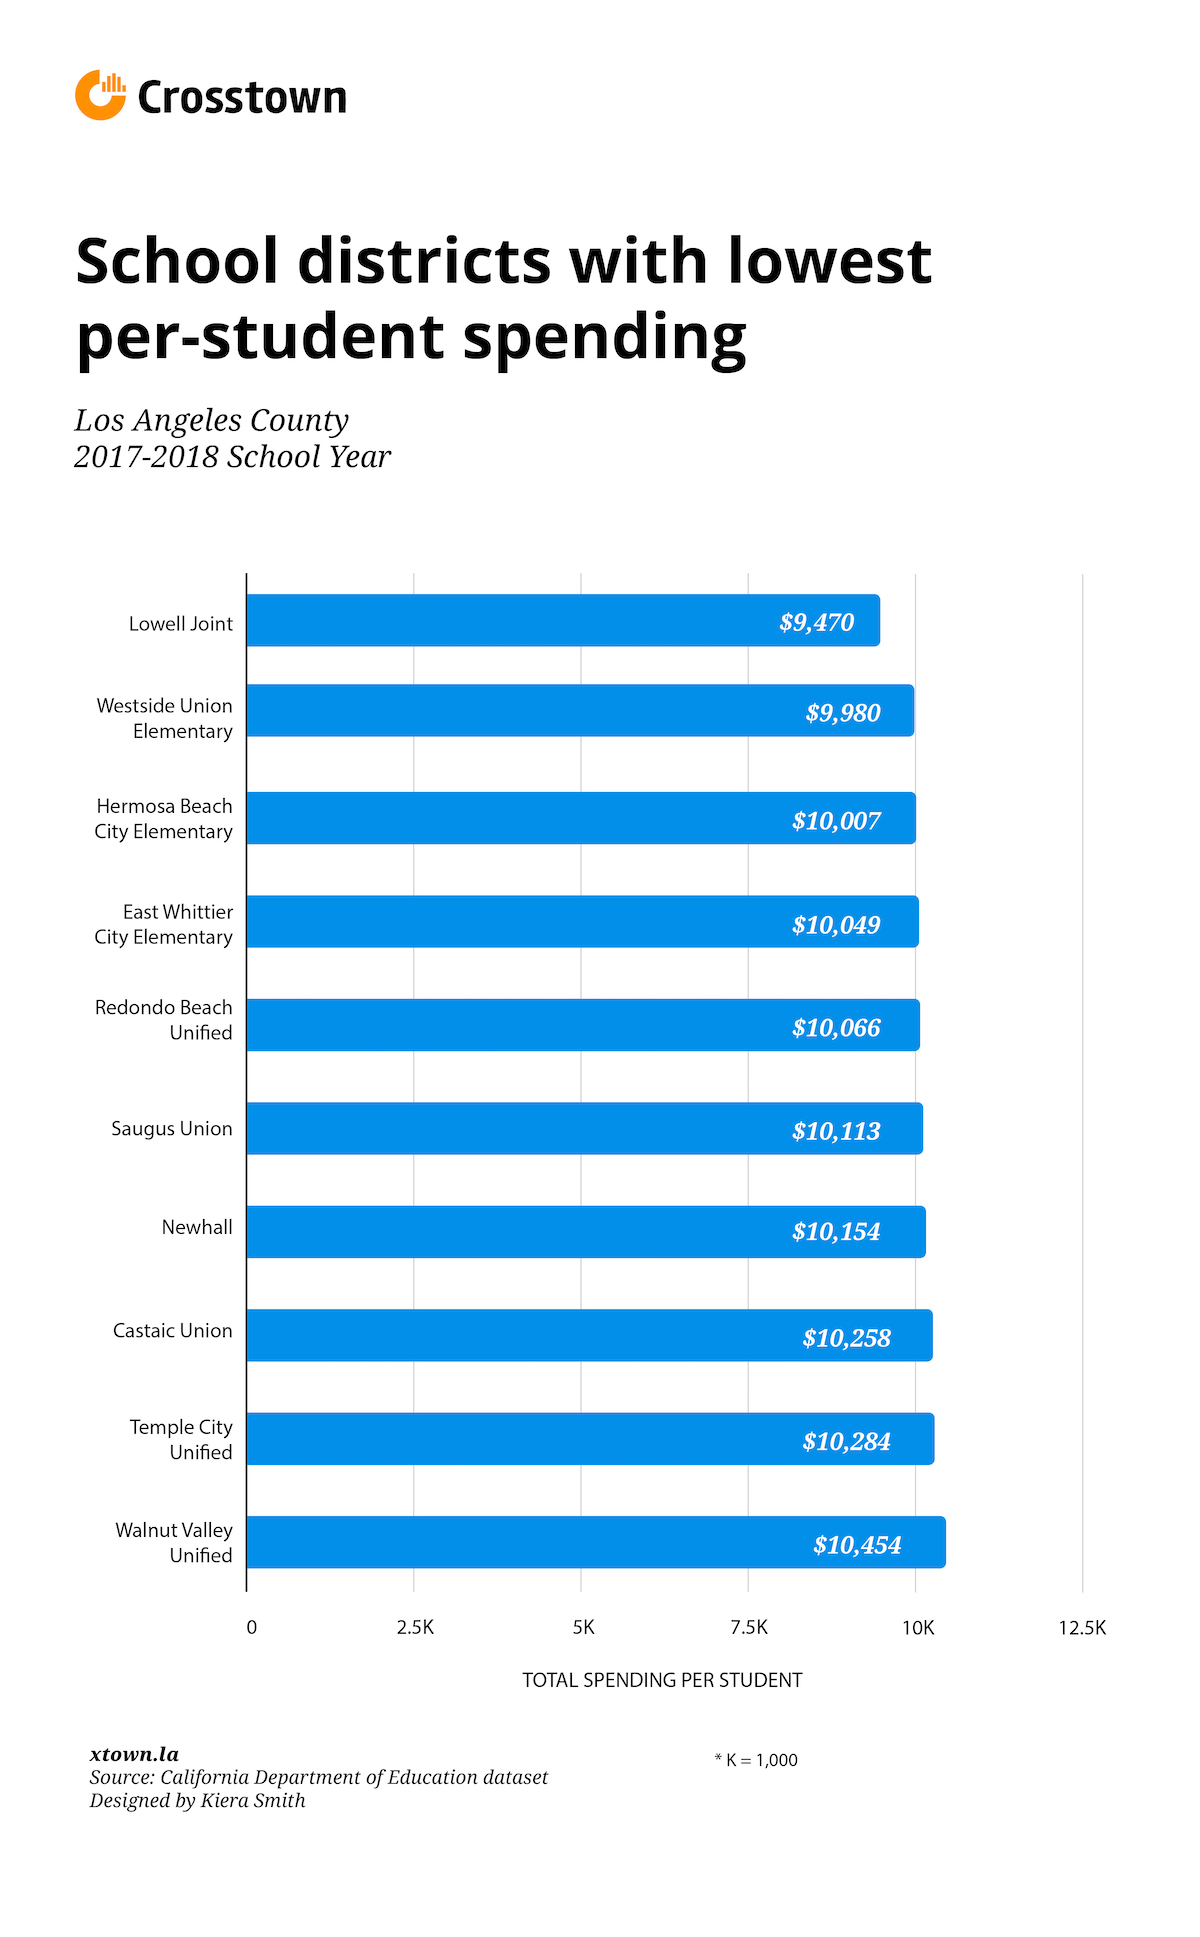
The Beverly Hills Unified School District spent over $18,000 per student in the 2017-18 school year, the highest in Los Angeles County. On the other end, the Lowell Joint School District, an elementary school district in Whittier, spent about half as much, at $9,470 per pupil.
Crosstown examined funding data for the 80 school districts in LA County that reported their budgets for the 2017-18 school year, the most recent year available. We found wide discrepancies in school spending per student across these districts.
This variation is the result of how districts receive money from two major sources: the California Department of Education, which determines funding based mainly on student need, and local financing, primarily made up of property tax revenue.
Per-student spending is an essential measure because it pays for teachers, counselors, administrative staff and instructional aid, according to Julien Lafortune, a research fellow from the nonprofit Public Policy Institute of California, who specializes in K-12 education.
[How much does your kid’s teacher get paid?]
“We care about that [money] because that’s the set of resources [school districts] have available to them,” Lafortune said.
On average, LA County public school districts spent $12,492 per student in 2017-18, falling slightly below the California average of $12,589, according to the California Department of Education. There were 40 school districts in the county that spent below the statewide average.
California has a complicated funding model, where some schools receive more money to supplement a high-need population, based on factors such as the proportion of students who are low income or English-language learners.
“More broadly, you could say that districts are given extra money if they have more disadvantaged students, and even more money if they have a lot of disadvantaged students,” said Paul Bruno, a PhD student in the USC Rossier School of Education who specializes in urban education policy.
School districts can also bring in money through property tax revenue. This often enables districts in wealthier areas – where property values tend to be higher – the ability to spend more money per student.
A growing body of research shows that increased school spending can result in better outcomes for disadvantaged students. One study from Policy Analysis for California Education – a research collaboration between five California-based universities – found that increased spending through the state’s funding formula “led to significant increases in high school graduation rates and academic achievement, particularly among poor and minority students.”
That does not mean that achievement depends solely on per-student spending.
The South Pasadena Unified School District and Beverly Hills Unified both received A-plus school ratings on Niche, a site that uses data from the U.S. Department of Education, parent and student surveys and other sources to rank schools, employers and neighborhoods. Yet South Pasadena Unified, located in the affluent city of South Pasadena, spent $7,500 less per student than Beverly Hills Unified did.
Students in wealthier areas may benefit from a range of outside resources, such as private tutoring.
“We often give schools more money precisely because they tend to have lower test scores,” said USC Rossier’s Bruno. “That doesn’t mean that the extra money doesn’t help, just that it may not be enough to cancel out all of the other factors that matter for students.”
So how much does your district spend per student? Check our interactive map below.
How we did it: We examined the California Department of Education’s publicly available data on per-student spending for school districts located within Los Angeles County. For neighborhood boundaries, we rely on the borders defined by the Los Angeles Times. Learn more about our data here.
Interested in our data? Email us at askus@xtown.la.


