

How much does your kid’s teacher get paid?


The lowest paid public-school teachers in Inglewood made $42,126 during the 2017 – 2018 school year, among the smallest paychecks for any teacher in Los Angeles County.
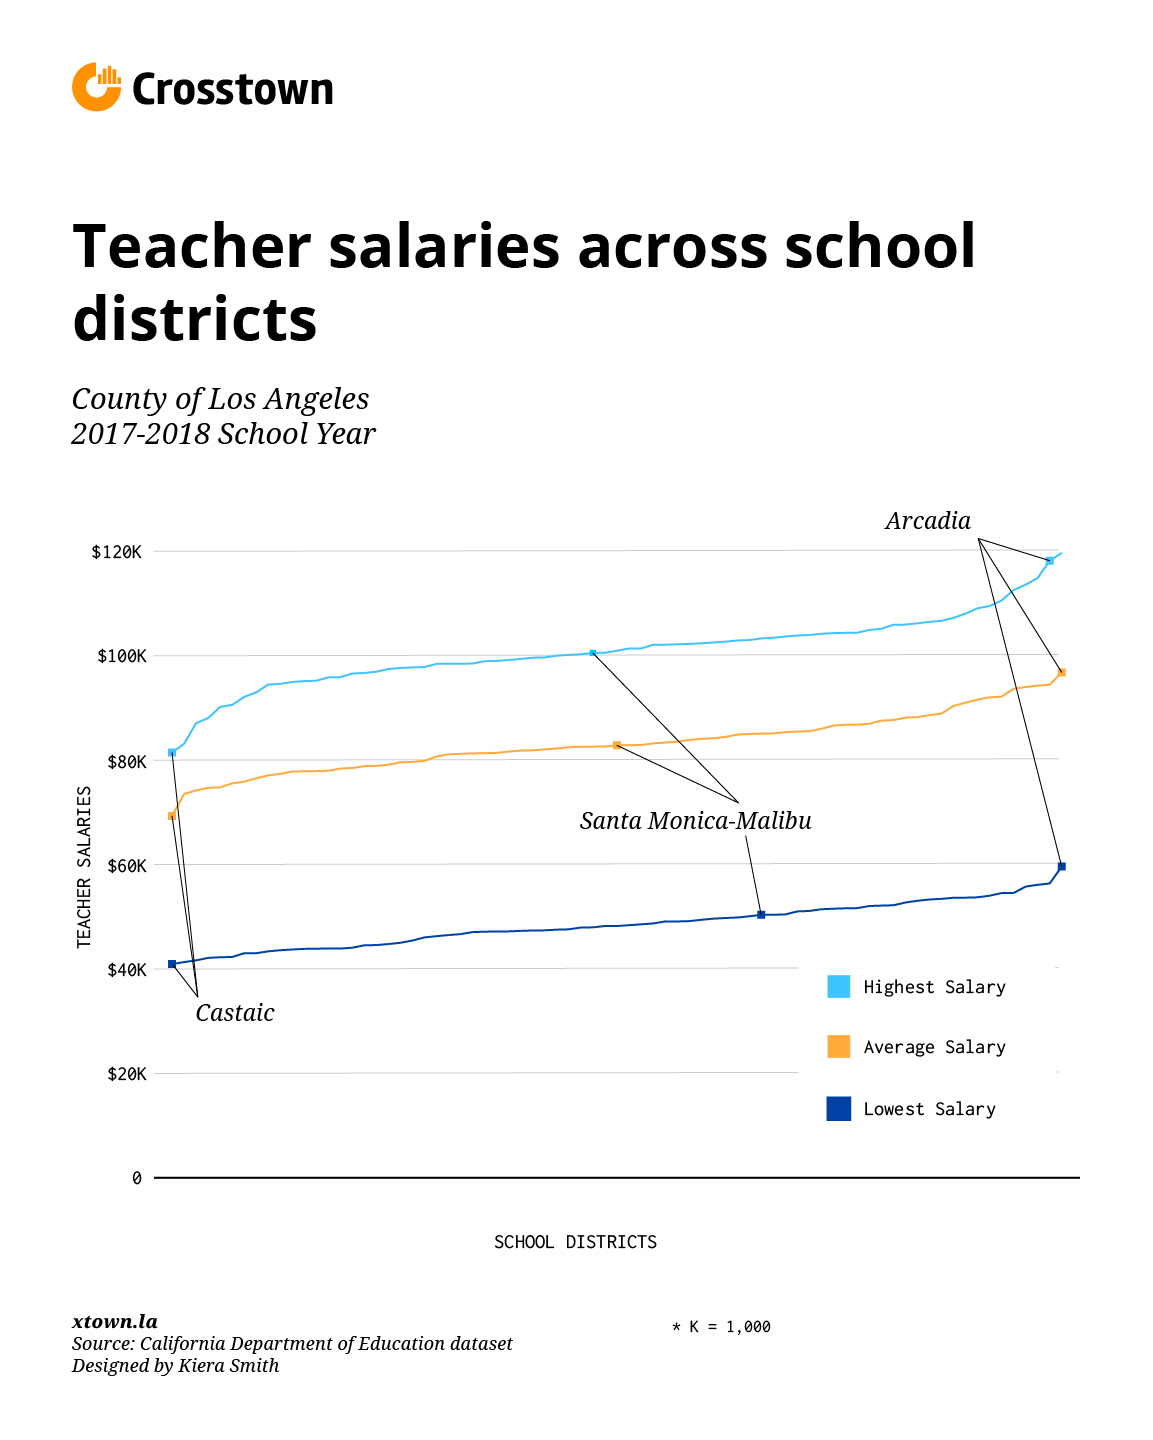
Some 25 miles to the northwest, in Arcadia, the lowest paid teachers made about 42% more, or $59,616.
Crosstown compared teacher salaries across the 75 LA County school districts that reported data for the 2017- 2018 school year, the most recent year available. We found a wide disparity in teacher compensation, a difference which can have a direct impact on quality of life for educators and on educational outcomes for kids.
Even teachers who have accumulated significant seniority find that they top out at different levels depending on where they work. The highest paid teacher in Castaic Union School District, near Santa Clarita, made $81,469, the lowest salary for an experienced teacher in the county. The Alhambra Unified School District, located in the West San Gabriel Valley, paid the highest salary for an experienced teacher in the county, $119,691. This was also the highest teacher salary paid by any school district in the county. (Principals and administrators often make more.)
School districts across California are struggling against a worsening shortage of qualified teachers. A 2016 study by the Palo Alto-based Learning Policy Institute, found that three out of four districts surveyed reported that they could not hire enough teachers. Experts predict the situation to deteriorate further as fewer people enroll in teacher training programs across the state.
Salaries and benefits are key to retaining teachers. Offering higher salaries can lead to lower teacher vacancy rates, according to a 2018 study from Policy Analysis for California Education, an independent research center.
“Happy employees are more productive employees and employees are happy when they know they’re financially taken care of,” said John Scanlan, assistant superintendent of human resources at the Alhambra Unified School District. He also emphasized the need for a positive school environment.
Retaining teachers can also impact student achievement. Schools with higher teacher turnover rates often also have lower student performance, according to a report from the Learning Policy Institute.
Last year, teachers in the Los Angeles Unified School District went on strike for more than a week to bargain for higher pay, smaller classes and improved school services, such as more on-site nurses.
Low-income school districts have particular trouble attracting and retaining qualified teachers, said Julien Lafortune, a research fellow at the Public Policy Institute of California who specializes in K-12 education. “A question we’ve been looking [at is]… should we try to give bonuses so teachers stay in those schools that need [them] the most?” he said.
The high cost of living in LA County places an extra burden on teachers working in low-paying districts. During the 2017-18 school year, the lowest-paid teachers at 58 LA County school districts made less than $52,000. That is the minimum income needed to put one-third of their pay toward the county’s median rent of $1,322 a month, as estimated by the American Community Survey.
An analysis by the Department of Housing and Community Development, based on data from the real estate firm Zillow, puts median rents even higher, from $2,452 to $4,342.
School districts generally determine teacher salaries based on education level and experience. However, there are massive disparities between districts in LA County because of the role teacher unions play in negotiating salaries, according to an analysis in school budget trends from the California Legislative Analyst’s Office. In addition, a Crosstown analysis illustrated how some districts have much more money than others. Beverly Hills Unified School District, for example, spends almost twice as much per student as some other districts.
[Learning curve: Yawning gaps in school funding across LA County]
Many teachers who work for the Alhambra Unified School District cannot afford to live nearby and instead commute from other counties, including Riverside, San Bernardino and Orange, said Tammy Scorcia, president of the Alhambra Teachers Association.
“I think for teaching in general, the hardest part is if I can afford to do my job, and where [I’m] going to live so I can continue to do that job,” Scorcia said.
California Gov. Gavin Newsom’s proposed 2020 budget would allocate $900 million toward hiring more teachers to ease statewide shortages. It includes designating $100 million towards bonuses for teachers who work for at least four years at a high-need school and who teach a subject where teacher shortages are especially acute, such as math or science.
How much does your district pay teachers? Check our interactive table below.
| Los Angeles County School District | 17-18 Lowest teacher salary | 17-18 Highest teacher salary | 17-18 average teacher salary |
| ABC Unified | $53,310 | $103,681 | $82,836 |
| Alhambra Unified | $43,597 | $119,691 | $85,364 |
| Antelope Valley Union High | $42,298 | $109,091 | $81,125 |
| Arcadia Unified | $59,616 | $118,205 | $96,806 |
| Azusa Unified | $51,541 | $97,768 | $84,887 |
| Baldwin Park Unified | $49,102 | $108,056 | $93,995 |
| Bassett Unified | $43,905 | $88,051 | $81,404 |
| Bellflower Unified | $50,389 | $98,500 | $82,468 |
| Beverly Hills Unified | $54,539 | $104,206 | $91,600 |
| Bonita Unified | $53,070 | $100,529 | $83,872 |
| Burbank Unified | $45,457 | $94,972 | $78,896 |
| Castaic Union | $40,938 | $81,469 | $69,300 |
| Centinela Valley Union High | $47,069 | $99,179 | $77,364 |
| Charter Oak Unified | $43,385 | $104,384 | $86,798 |
| Claremont Unified | $51,444 | $104,412 | $83,381 |
| Compton Unified | $43,021 | $96,943 | $82,586 |
| Covina-Valley Unified | $47,376 | $102,687 | $86,785 |
| Culver City Unified | $52,143 | $101,382 | $82,239 |
| Downey Unified | $56,126 | $114,890 | $94,444 |
| Duarte Unified | $50,089 | $97,835 | $75,872 |
| East Whittier City Elementary | $47,537 | $102,102 | $85,025 |
| Eastside Union Elementary | $46,056 | $100,952 | $78,497 |
| El Monte City | $49,761 | $102,998 | $88,613 |
| El Monte Union High | $53,644 | $105,941 | $87,588 |
| El Rancho Unified | $47,977 | $97,462 | $80,688 |
| El Segundo Unified | $45,020 | $99,626 | $82,856 |
| Garvey Elementary | $49,635 | $102,081 | $85,086 |
| Glendale Unified | $48,718 | $103,874 | $84,419 |
| Glendora Unified | $46,501 | $99,675 | $88,137 |
| Hacienda La Puente Unified | $53,660 | $102,917 | $85,985 |
| Hawthorne | $47,299 | $100,010 | $81,882 |
| Inglewood Unified | $42,126 | $83,125 | $74,195 |
| Keppel Union Elementary | $43,014 | $98,959 | $76,527 |
| La Cañada Unified | $50,447 | $102,266 | $85,538 |
| Lancaster Elementary | $48,227 | $103,314 | $82,064 |
| Las Virgenes Unified | $47,142 | $98,998 | $79,653 |
| Lawndale Elementary | $56,383 | $104,333 | $88,915 |
| Lennox | $53,728 | $102,533 | $90,391 |
| Little Lake City Elementary | $47,948 | $96,596 | $77,084 |
| Long Beach Unified | $52,208 | $109,519 | $92,033 |
| Los Angeles County Office of Education | $47,195 | $94,622 | $81,209 |
| Los Angeles Unified | $43,913 | $87,085 | $74,789 |
| Lowell Joint | $44,074 | $99,384 | $85,119 |
| Lynwood Unified | $48,555 | $94,480 | $79,588 |
| Manhattan Beach Unified | $53,435 | $100,572 | $86,968 |
| Monrovia Unified | $51,660 | $98,462 | $78,403 |
| Montebello Unified | $47,204 | $106,683 | $92,156 |
| Mountain View Elementary | $51,625 | $106,483 | $94,271 |
| Newhall | $49,096 | $92,976 | $74,700 |
| Norwalk-La Mirada Unified | $52,733 | $107,259 | $88,239 |
| Palmdale Elementary | $49,417 | $110,575 | $81,835 |
| Palos Verdes Peninsula Unified | $54,557 | $102,189 | $83,508 |
| Paramount Unified | $54,038 | $103,963 | $86,611 |
| Pasadena Unified | $43,901 | $90,585 | $73,519 |
| Pomona Unified | $46,287 | $102,380 | $81,287 |
| Redondo Beach Unified | $55,786 | $100,168 | $84,193 |
| Rosemead Elementary | $48,389 | $105,959 | $91,009 |
| Rowland Unified | $50,371 | $106,213 | $87,681 |
| San Gabriel Unified | $42,252 | $92,119 | $77,895 |
| San Marino Unified | $52,062 | $103,440 | $83,198 |
| Santa Monica-Malibu Unified | $49,859 | $100,278 | $82,621 |
| Saugus Union | $44,584 | $95,203 | $81,332 |
| South Pasadena Unified | $44,783 | $112,570 | $84,070 |
| South Whittier Elementary | $47,598 | $96,690 | $82,569 |
| Sulphur Springs Union | $43,851 | $90,195 | $75,564 |
| Temple City Unified | $43,736 | $98,443 | $82,908 |
| Torrance Unified | $48,234 | $95,902 | $79,863 |
| Walnut Valley Unified | $46,680 | $105,160 | $81,644 |
| West Covina Unified | $49,169 | $98,477 | $77,818 |
| Westside Union Elementary | $44,544 | $104,940 | $77,864 |
| Whittier City Elementary | $41,321 | $97,658 | $79,117 |
| Whittier Union High | $51,029 | $113,614 | $93,678 |
| William S. Hart Union High | $47,400 | $95,863 | $78,855 |
| Wilsona Elementary | $41,650 | $95,145 | $77,966 |
| Wiseburn Unified | $51,110 | $101,385 | $85,479 |
How we did it: We examined the California Department of Education’s publicly available data on teacher salaries for each school district located within Los Angeles County. For neighborhood boundaries, we rely on the borders defined by the Los Angeles Times. Learn more about our data here.
Interested in our data? Email us at askus@xtown.la.


