

What LA looks like on lockdown


The first confirmed case of COVID-19 hit LA County on Jan. 26. On March 4, California Gov. Gavin Newsom declared a state of emergency. Since then, a series of measures have limited movement and commerce and changed the course of daily life.
Now that Angelenos are required to stay home, we are able to get a sense of the impact the health measures are having on everything from crime to traffic collisions, even the price of gas at the pump.
We used data to chart some of the ways in which life is slowing down across the city.
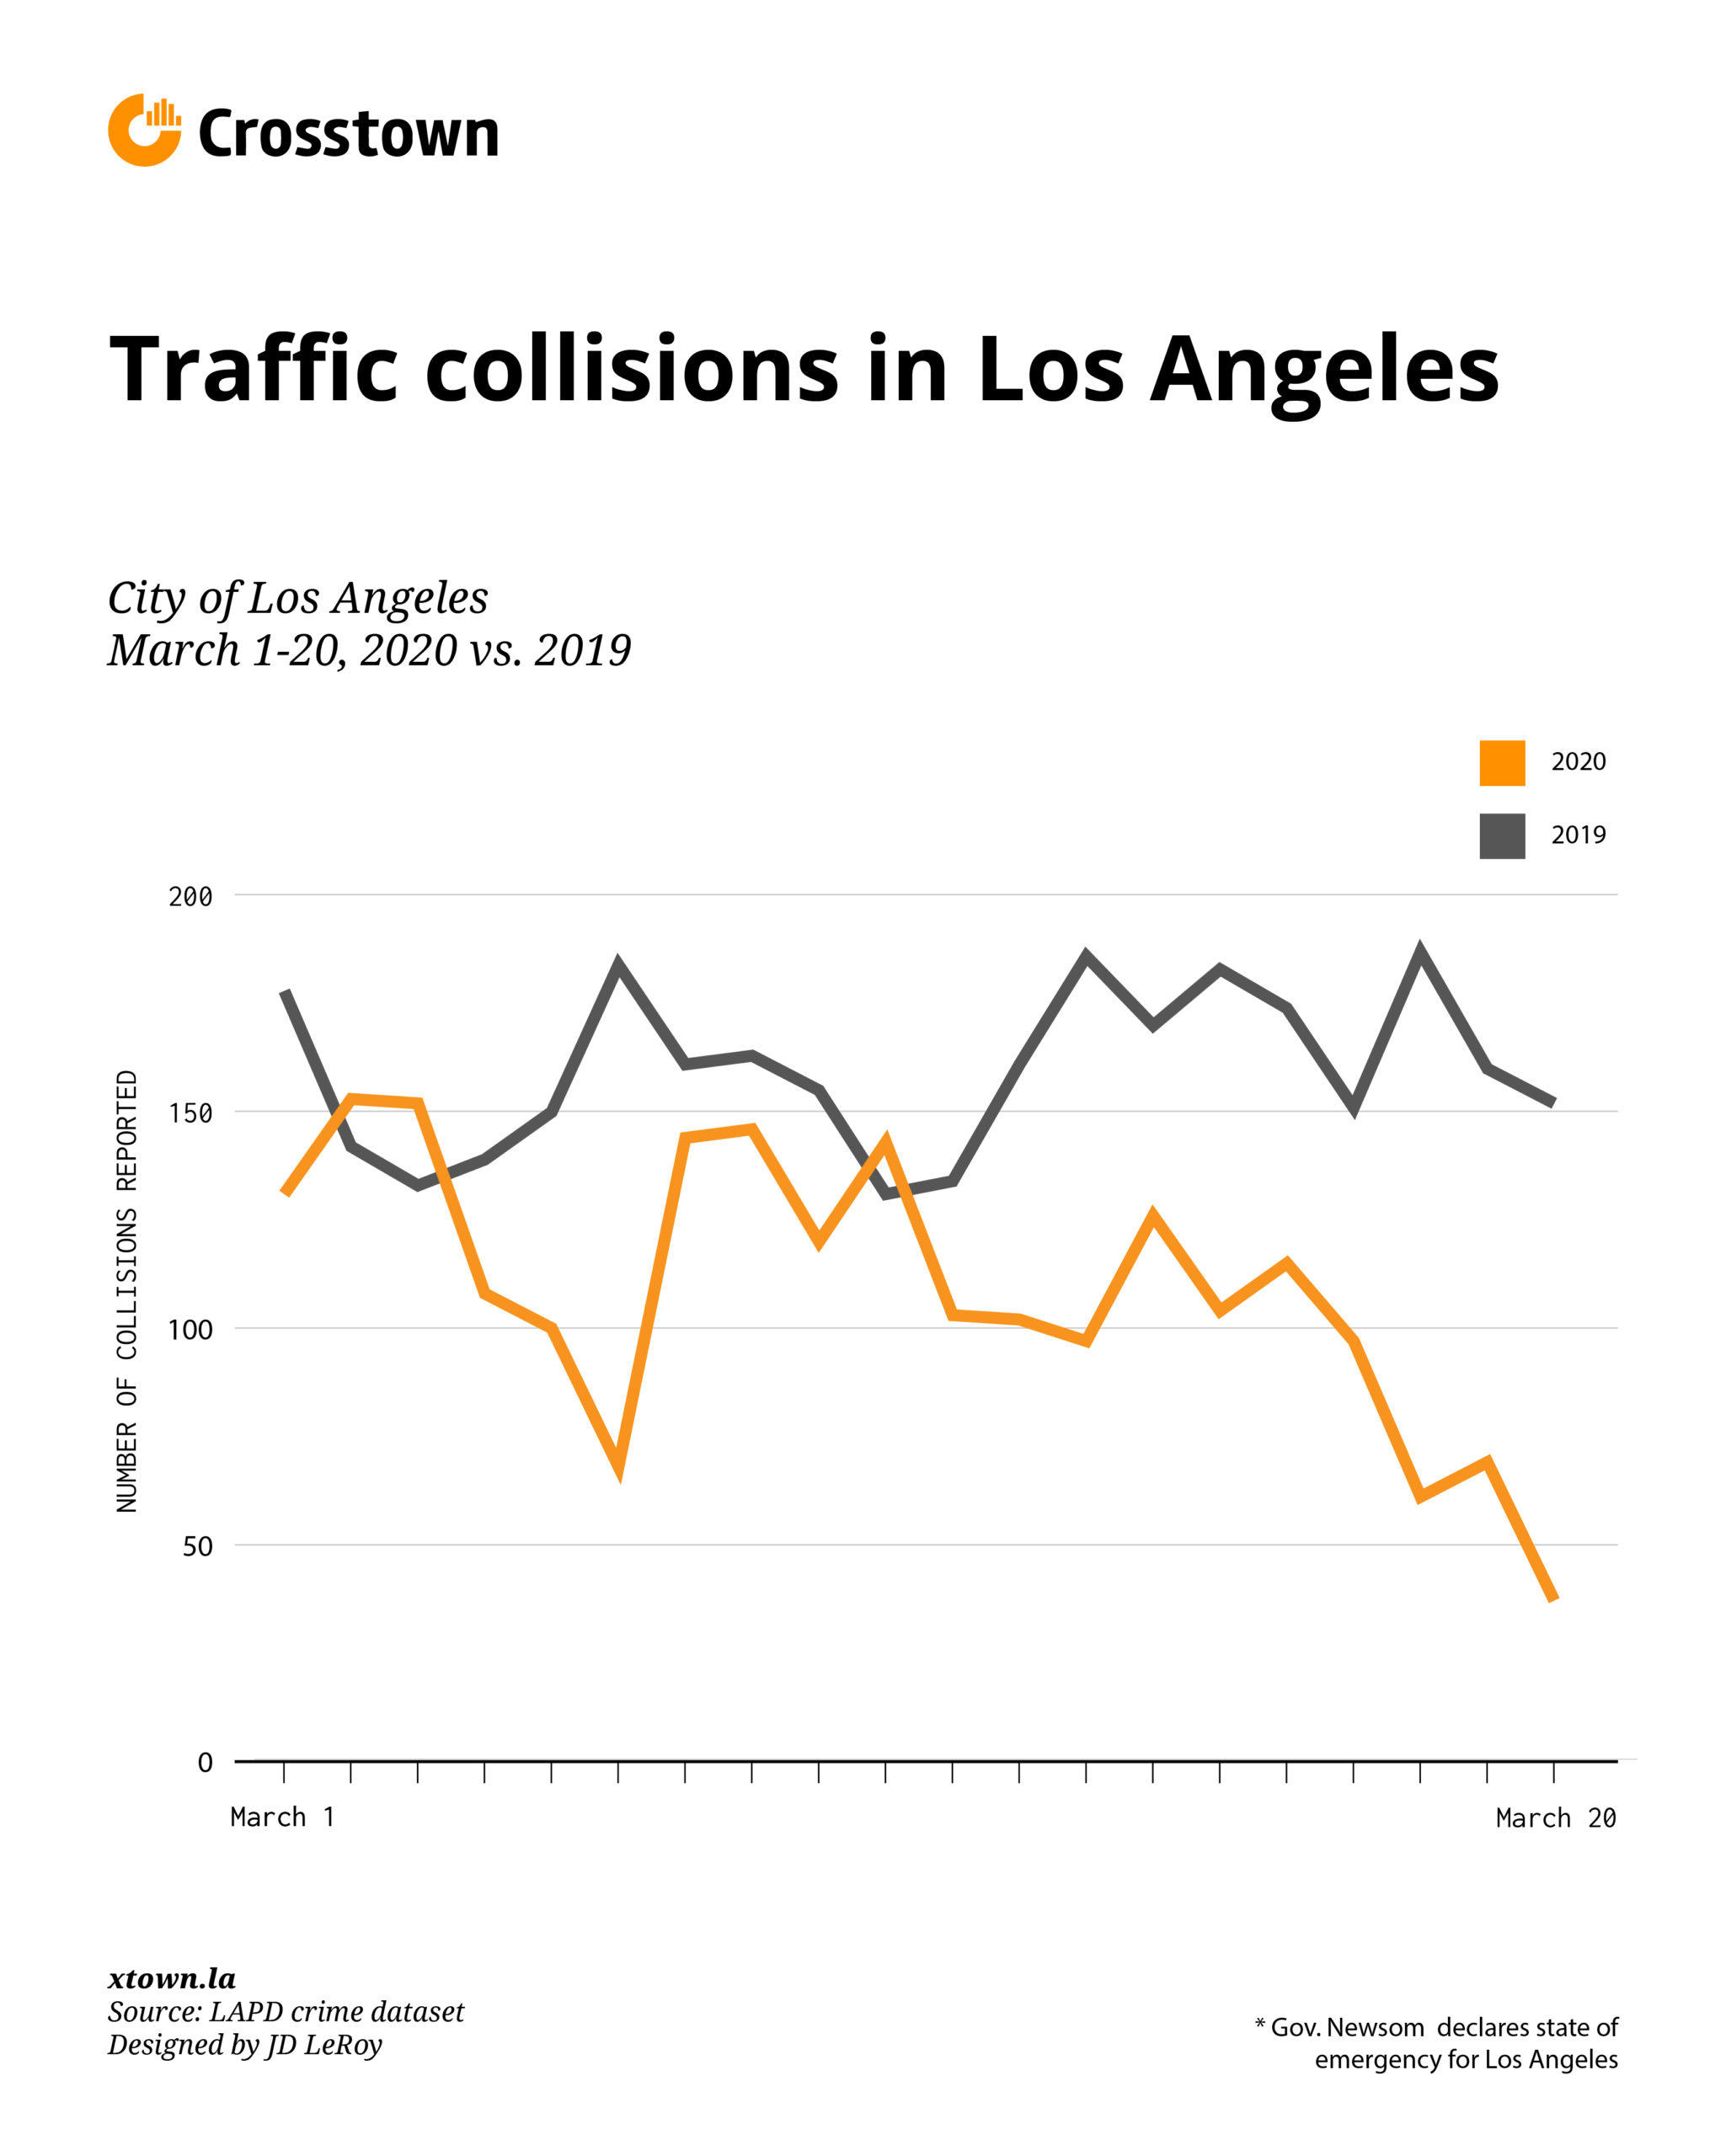
Traffic collisions in the City of Los Angeles
On a normal weekday, Los Angeles averages about 150 traffic collisions a day. But as anti-virus measures were implemented across the city, the roads and highways have become safer.
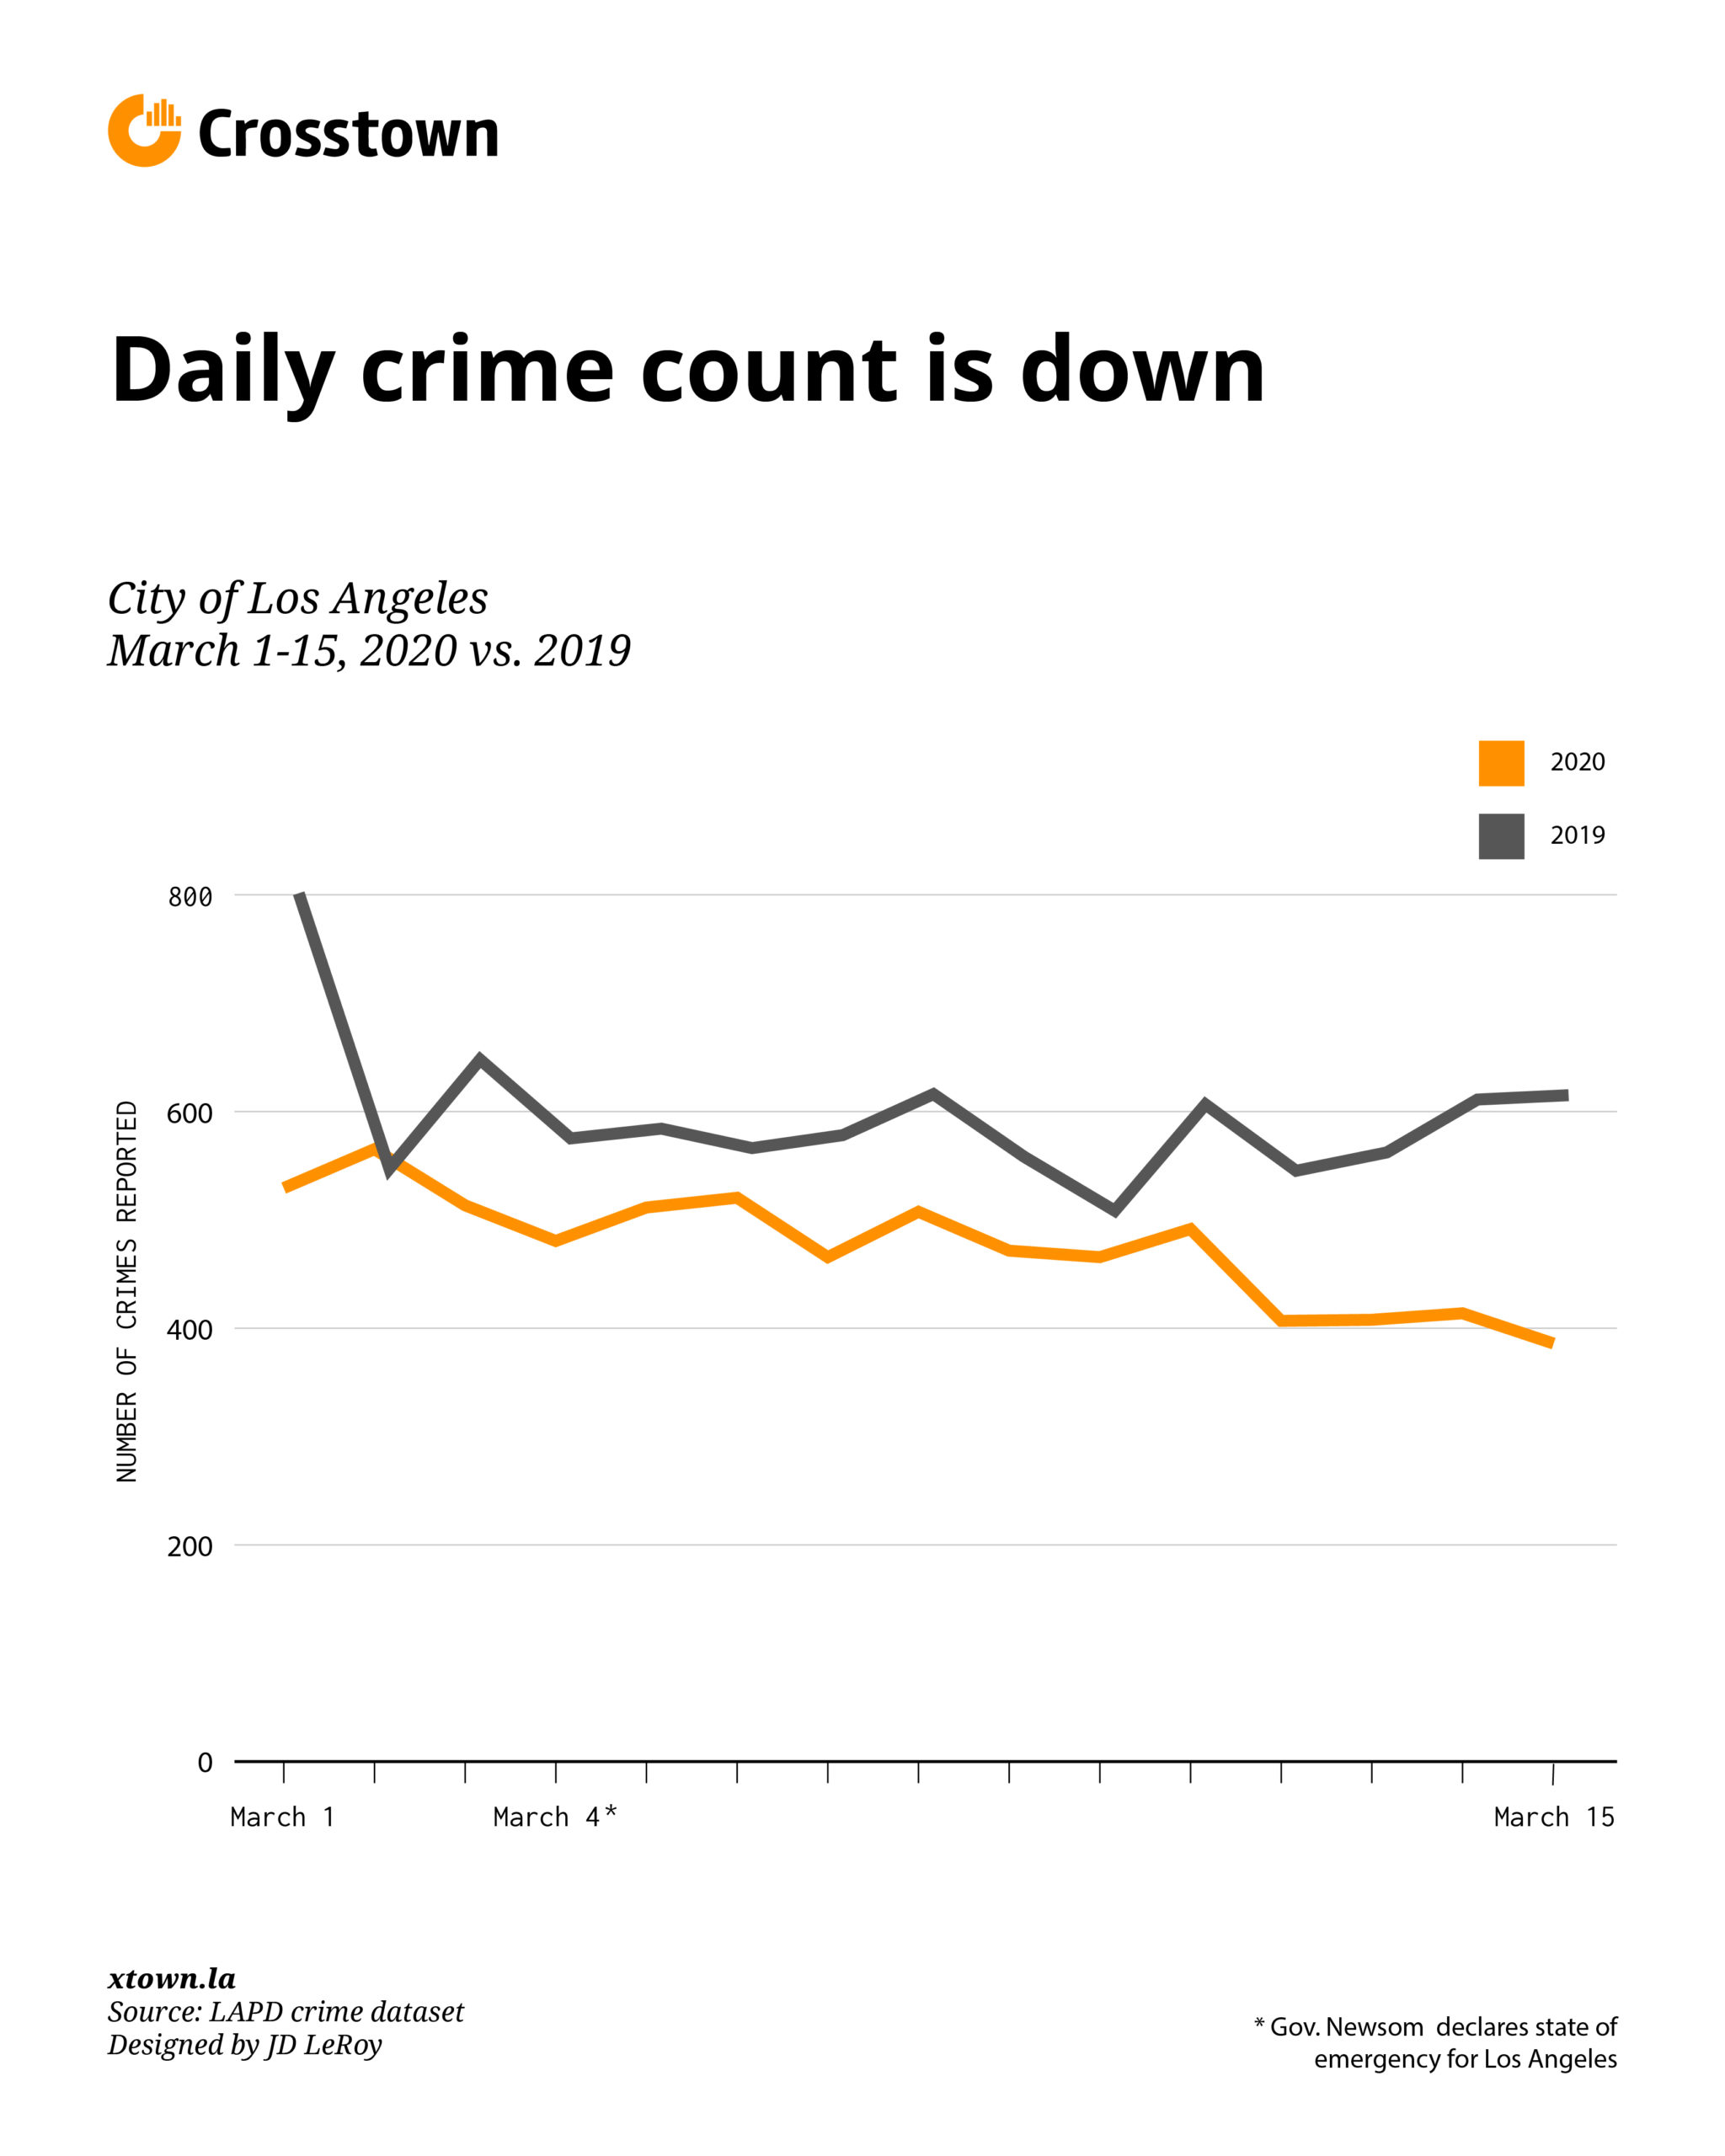
Daily crime
As more Angelenos stay inside, the number of crime reports has also fallen. Typically, almost 600 crimes occur each day in Los Angeles. But in March, the numbers began to drop, averaging only 477 a day during the first half of the month.
Daily arrests in LA
The Los Angeles Police Department has also been changing the way it responds. Yes, there have been fewer crime reports. But the LAPD has also altered its policies to make fewer arrests, in part to prevent crowding in county jails in order to reduce the risk of spreading the coronavirus infection further.

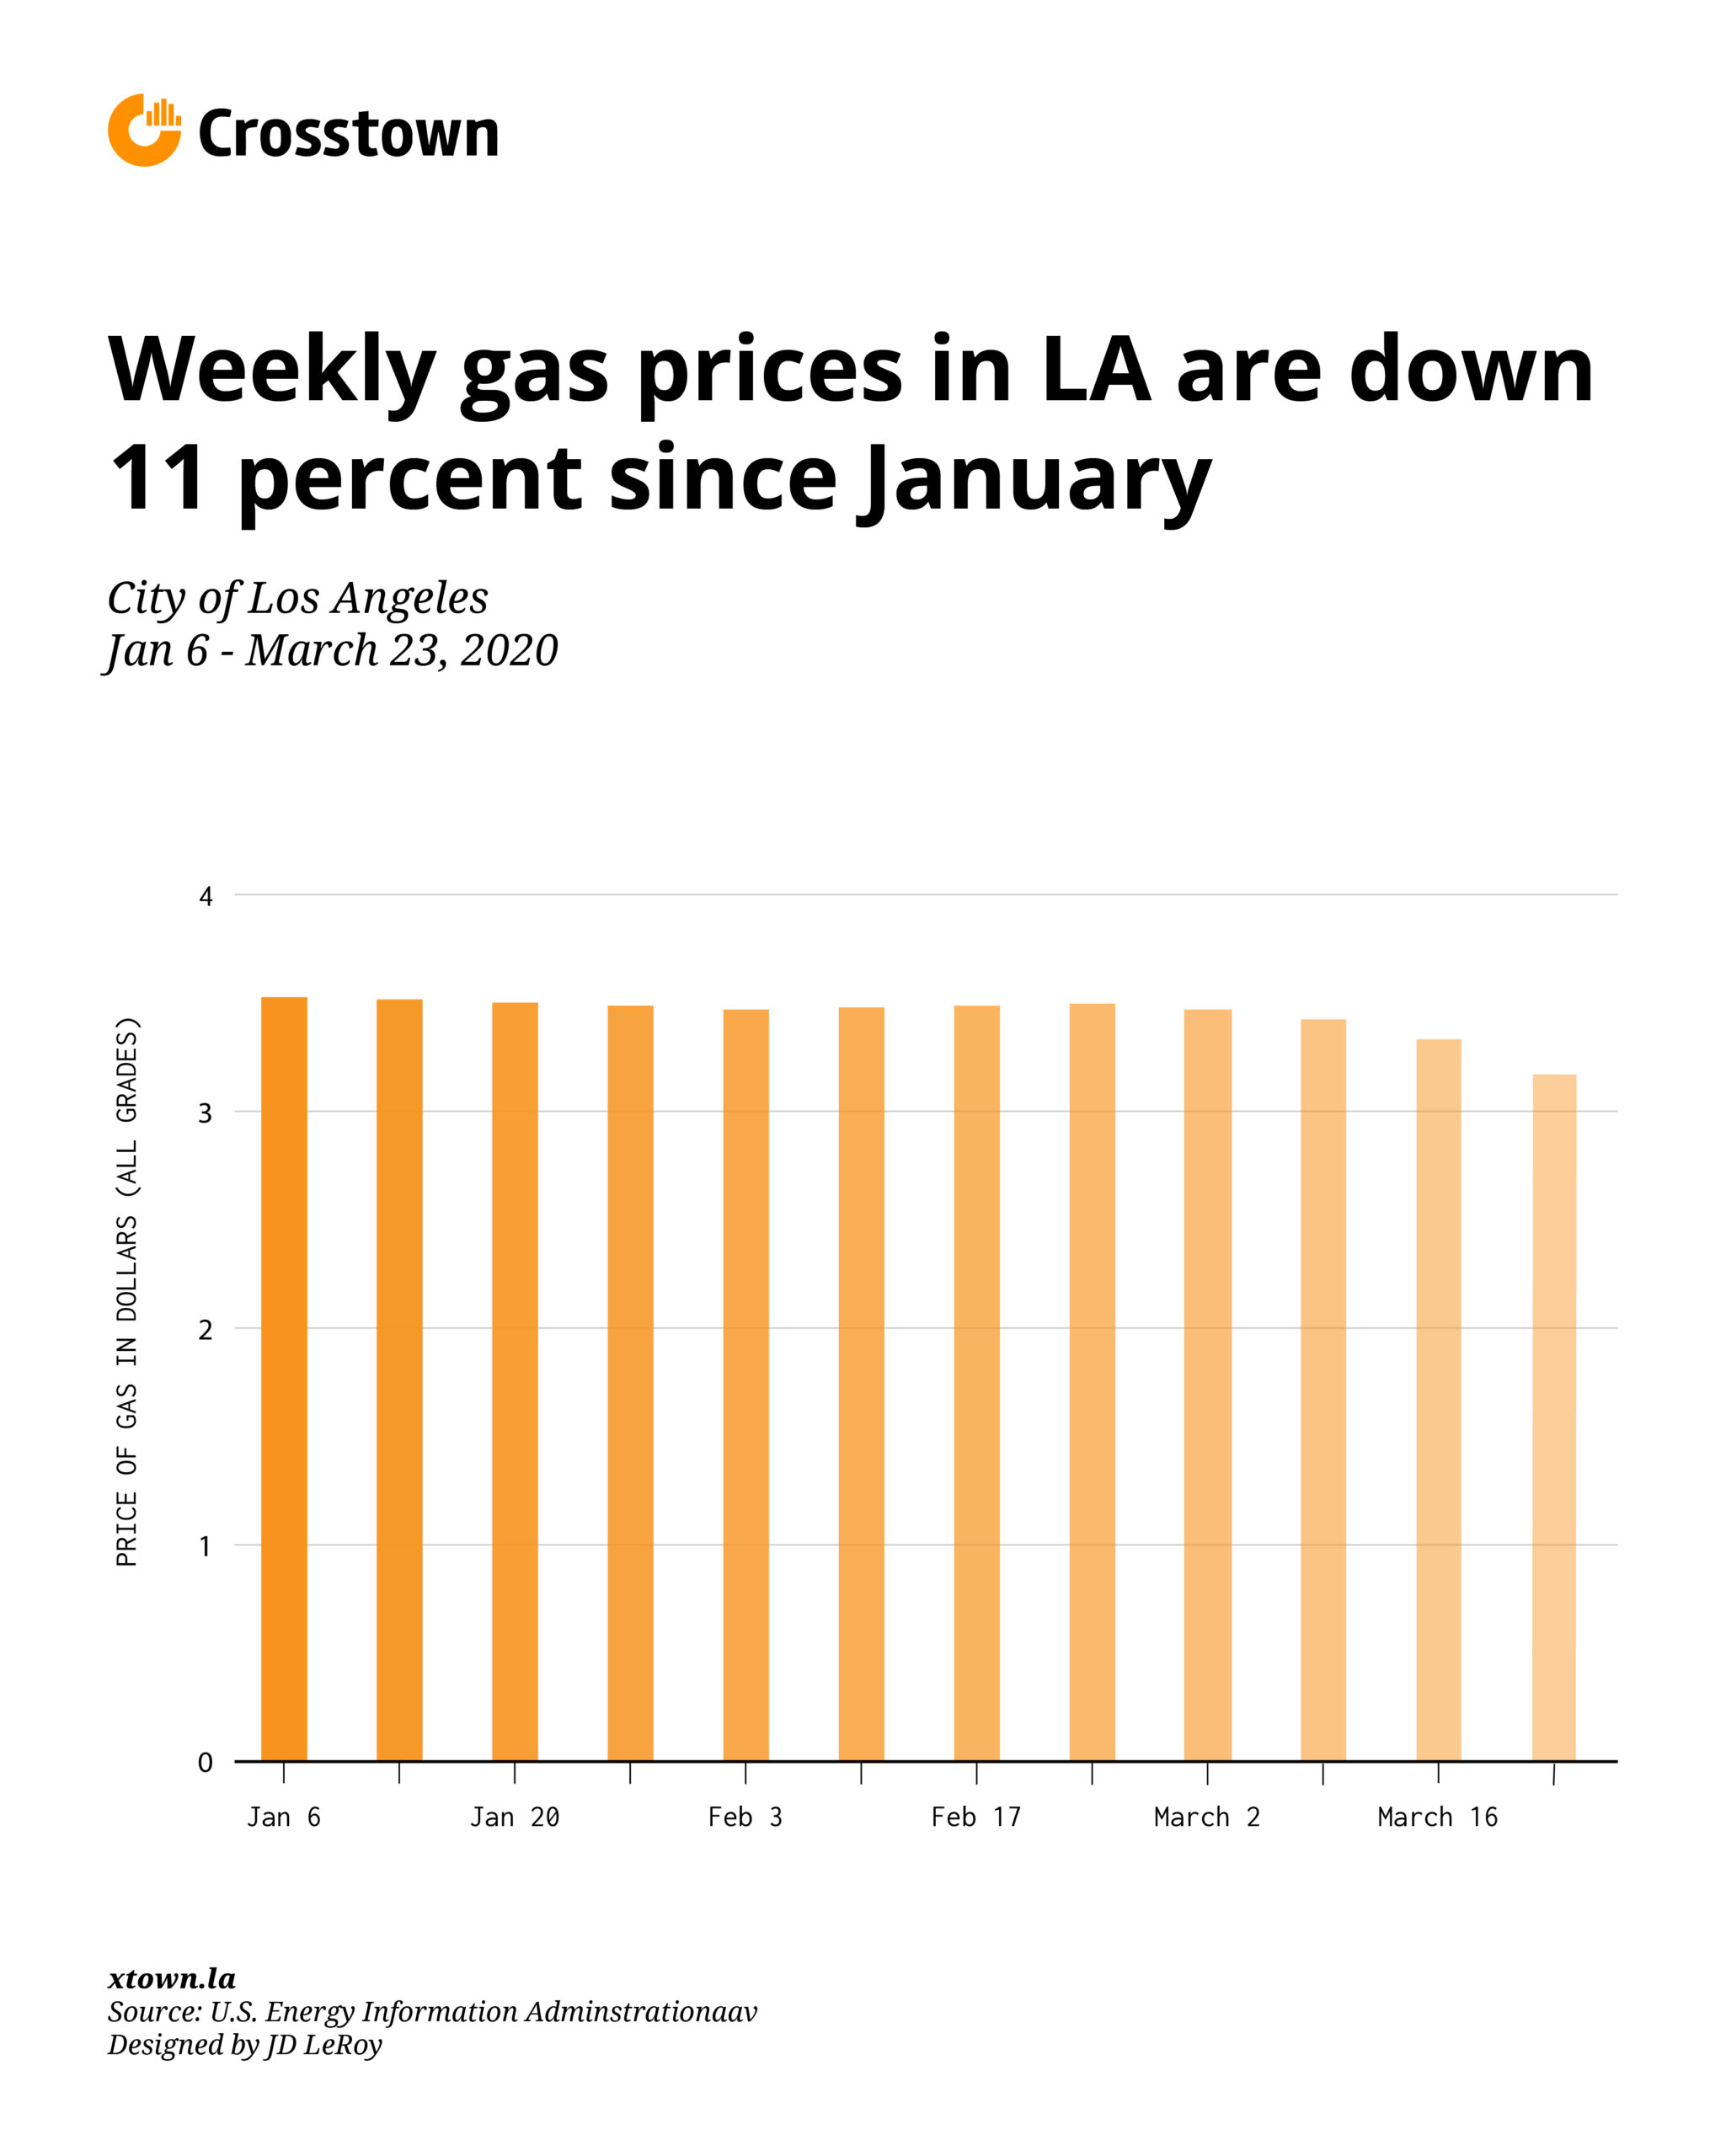
Gas prices in LA
One welcome decrease comes in the form of gas prices, which have dropped 11% since January. Not only are people driving less, which lowers demand, but Saudi Arabia and Russia, two of the world’s largest oil producers, have been locked in a price war, flooding the market with excess supply. Although Angelenos are free to drive for now, those trips will likely be to grocery stores and pharmacies, since all non-essential business is closed in the city.
How we did it: We examined publicly available LAPD data, arrest and traffic. For neighborhood boundaries, we rely on the borders defined by the Los Angeles Times. For gas prices, we used data from the U.S. Energy Information Administration. Learn more about our data here.
LAPD data only reflect crimes that are reported to the department, not how many crimes actually occurred. In making our calculations, we rely on data agencies to make publicly available.
The LAPD does periodically update past crime reports with new information, which sometimes leads them to recategorize past reports. Those revised reports do not always automatically become part of the public database. We try to update our reporting when new data becomes available.
Want to know how your neighborhood fares? Or simply just interested in our data? Email us at askus@xtown.la.


