

Traffic reductions hold steady across LA, even after months of quarantine


When the coronavirus shutdown orders were issued back in March, traffic on Los Angeles streets miraculously vanished. Some 10 weeks later, there’s another miracle: It hasn’t come back.
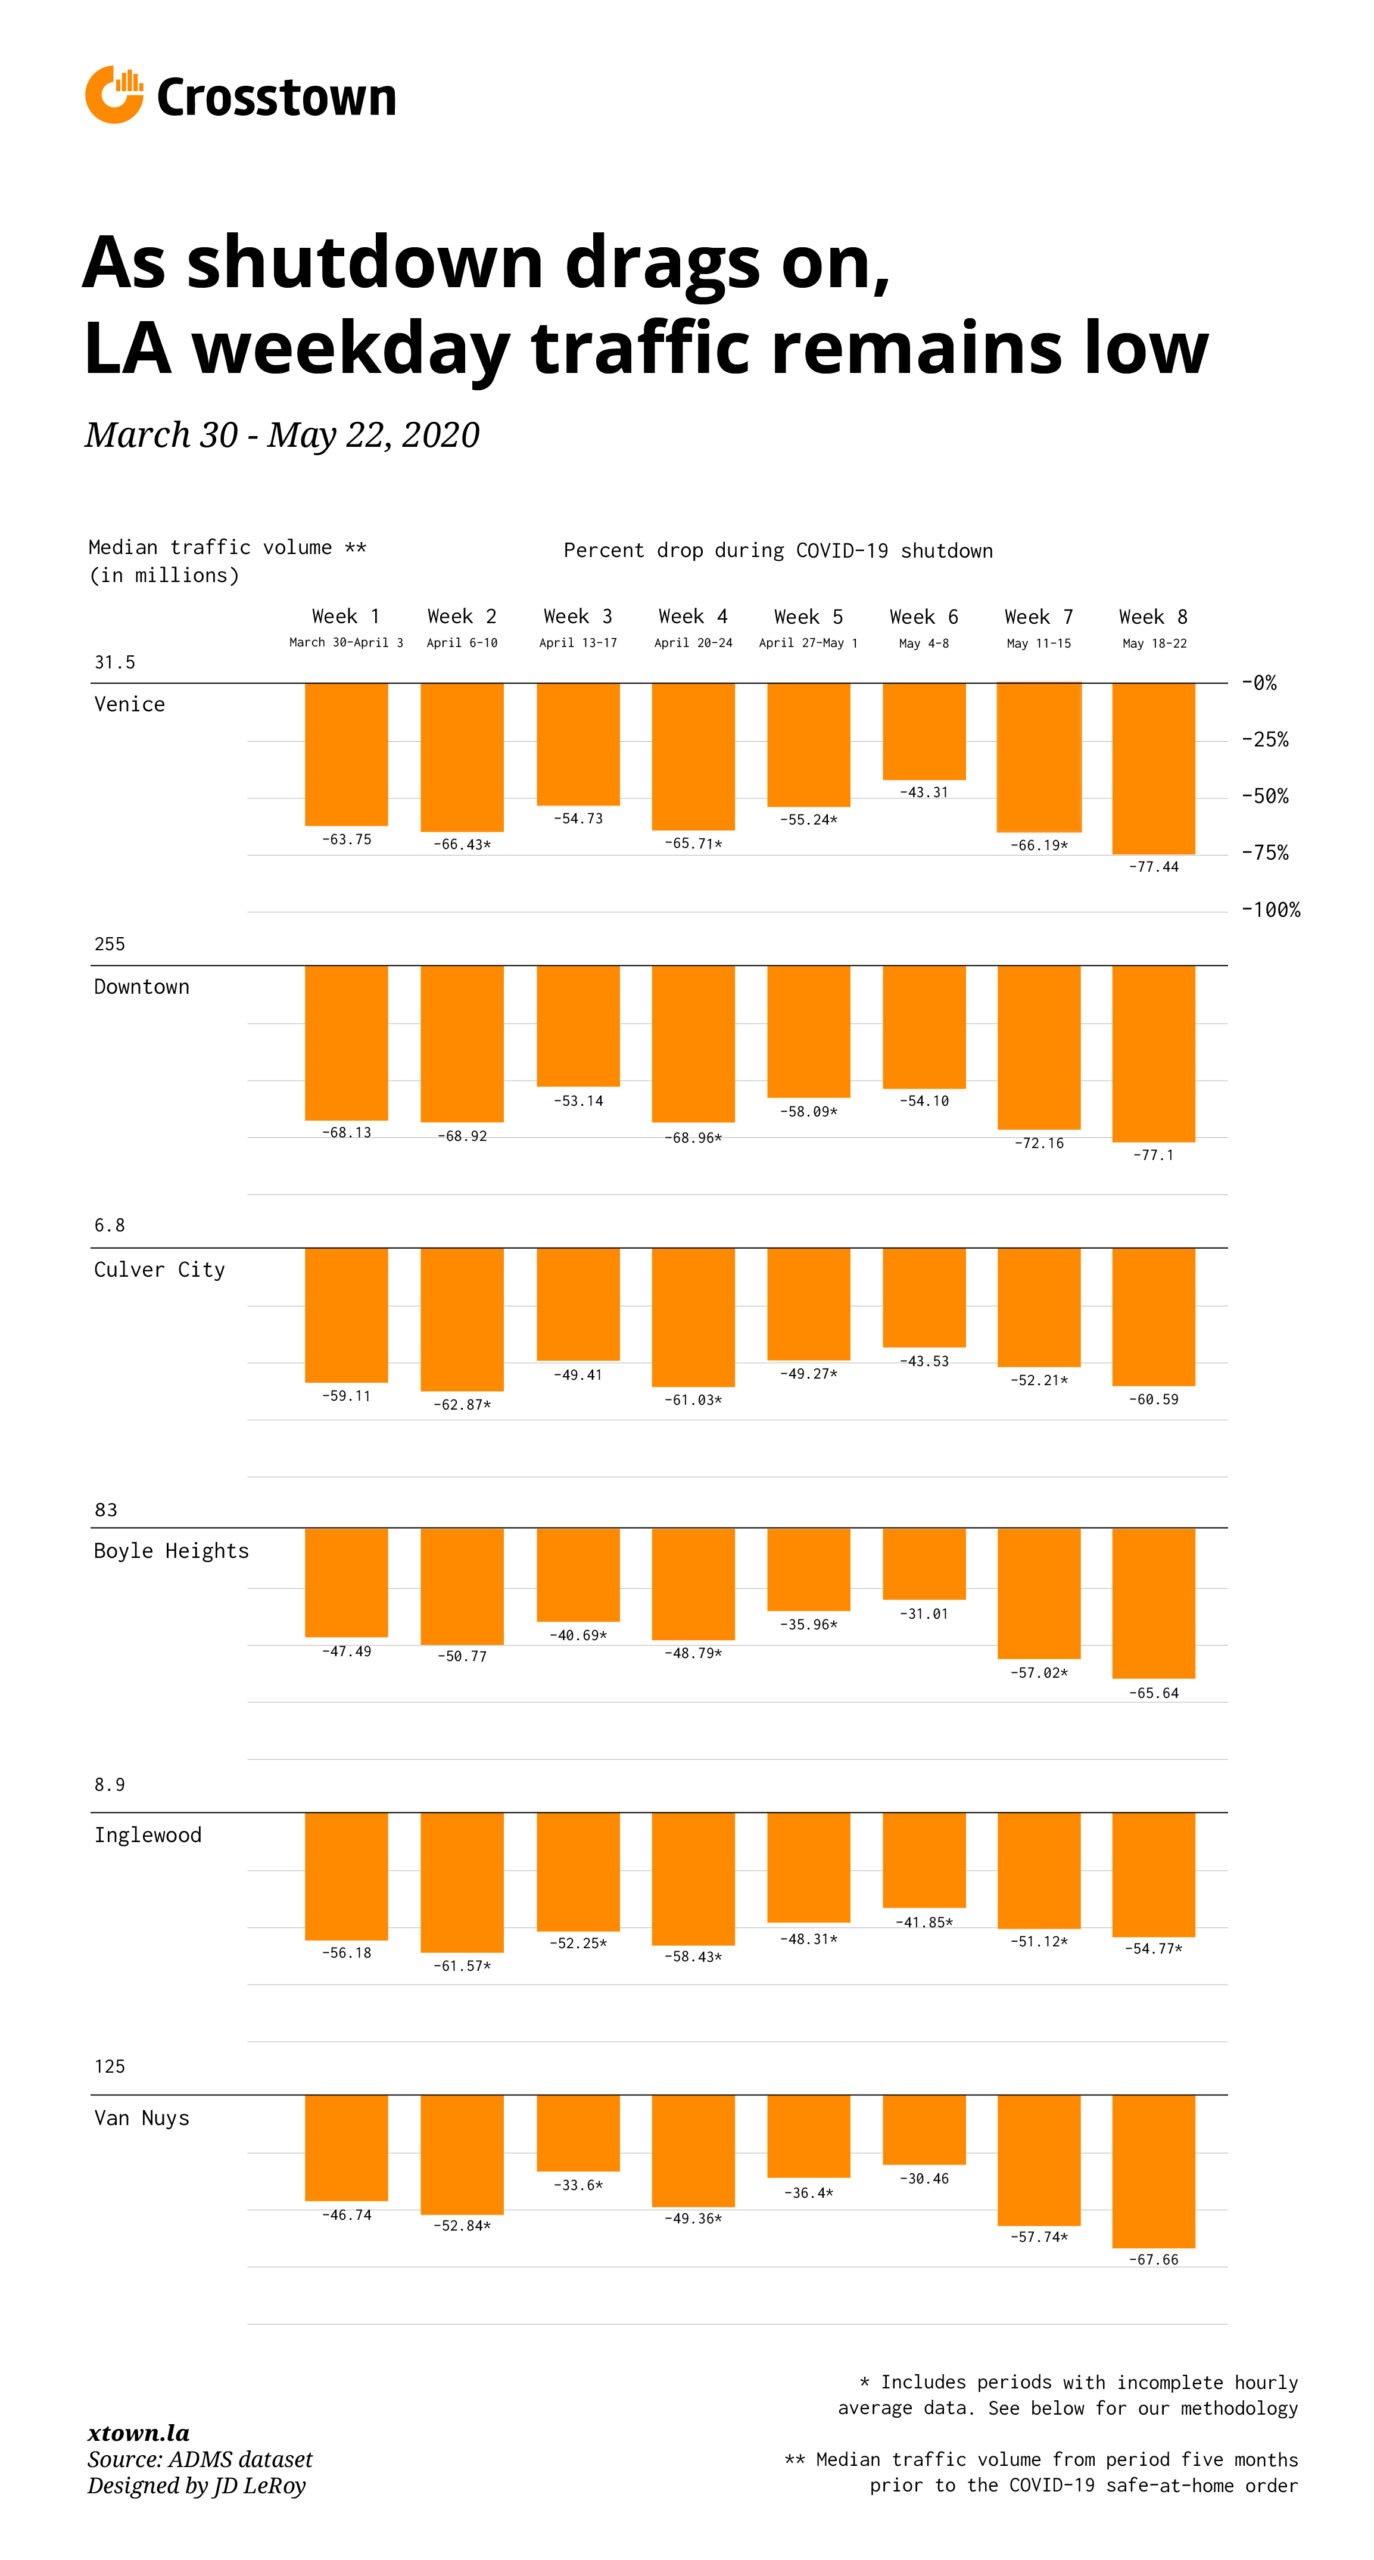
Though the number of cars on the roadways has fluctuated from day to day, weekday traffic in most areas in Los Angeles County remains at least 50% below pre-virus levels. In some cases, it has been even lower in recent weeks than immediately after the lockdown began, on March 19.
The sparse traffic, even this long after the quarantine began, is one barometer of the degree of social-distancing taking place across the region. It’s also a bright spot for air quality, as Los Angeles has enjoyed a protracted period of relatively clear skies.
Open roads
Crosstown examined weekday vehicle-volume data for six areas around Los Angeles from March 30 through May 22. We compared it with vehicle-volume from five months earlier, before the COVID-19 pandemic hit. The data collected measures the number of vehicles traveling on major arterial roadways, such as Wilshire, Sepulveda and Ventura Boulevards. The data does not include freeway traffic.
The success Los Angeles has had in keeping cars off the road and people at home is playing out nationally as well, even as some high-profile demonstrations call for businesses to re-open, said Tim Lomax of the Texas A&M Transportation Institute.
“It seems like the story we’re seeing is that while there is some cabin fever, traffic has come back a little bit from the first few weeks, but it hasn’t come back to anywhere near normal,” he said.
Lomax noted that there was evidence to suggest that the sheer duration of the stay-at-home orders in many parts of the nation had forced people to adapt. “People are getting more comfortable working from home, shopping from home,” he said. “There is a lot more social distancing going on than some might suspect.”
School’s out
While Los Angeles has recently begun a gradual re-opening of non-essential business, several major contributors to traffic – such as schools – remain closed.
“If the schools are closed, all the people who can’t find daycare are at home as well,” said Lomax.
Josh Cordero, who drives a FedEx delivery truck around Los Angeles, said he has not noticed any dramatic change, even in recent weeks. “It might be inching up a little bit, but only a little,” he said. “There has been no surge.”
Public transit ridership has also dropped broadly county-wide. According to data from LA Metro, the number of bus and rail passengers slumped to 10 million in April from 30.4 million in January, when the nation’s first COVID-19 case was diagnosed in Washington.
The period we examined does not include the partial re-opening that began on May 29, when Los Angeles received permission from the state to reopen many restaurants, nail salons and barbershops. Nor does the period include the recent weekend, which saw widespread protests in reaction to police killing George Floyd, an unarmed black man under police custody, in Minneapolis.
The compliance in Los Angeles with stay-at-home-orders has not been uniform, however. Some beaches and trails had to be closed after throngs of visitors disregarded social-distancing rules. And the number of parties that the Los Angeles Police Department has had to shut down has jumped significantly since the coronavirus lockdown began.
How we did it: We examined data from the ADMS traffic map to track vehicle volumes for various neighborhoods. We compared current daily volume data for each area with traffic volume from five months earlier. Learn more about our data here. When hourly average data was incomplete or unavailable for parts of certain days, we created averages using days of the week for which data was available.
To calculate median traffic volumes from the period prior to the coronavirus shutdown, we selected levels that fell in the middle of the range of traffic volumes for an average week.
Want to know how your neighborhood fares? Or simply just interested in our data? Email us at askus@xtown.la.


