

COVID-19’s uneven spread across LA County


June was a bad month for COVID-19 cases in Los Angeles County, but for the neighborhood of West Los Angeles, it was especially rough. The area, located just south of Westwood, had more than four times the amount of new infections in June, at 116, than it did in May.
In fact, of the 247 areas in Los Angeles County that Crosstown tracks, 199 registered more infections in June than in May. Six were steady and 42 saw a decline.
Across all of Los Angeles County in June, the number of new infections rose from 30,781 in May to 45,539 in June, a 48% increase. Since the beginning of July, the pace of new infections in the county has only accelerated, with July 7 hitting a new daily record with 4,015 cases, in part because of a backlog of tests that the Los Angeles County Department of Public Health just received.
Coronavirus mortality rates in the county appear to be declining, however. In late June, roughly 4% of overall cases resulted in death. In early July, that rate fell to around 3%. Health officials say that may be driven in part by the fact that many of the newly infected are younger and healthier. This month, the county’s Department of Public Health began warning that about 50% of those that test positive for the virus are between 18 and 40 years old.
Some areas spike, others decline
Across the state, many of the areas that have been hardest hit are both densely populated and home to low-income workers. In addition, many low-wage workers are deemed “essential,” and must staff supermarket cash registers, nursing facilities or other places where they run the risk of contagion. Indeed, within Los Angeles County, some densely inhabited areas, such as East Compton and La Puente, reported 228% to 230% increases in new cases in June.
LA County areas with large increases of new cases between May and June
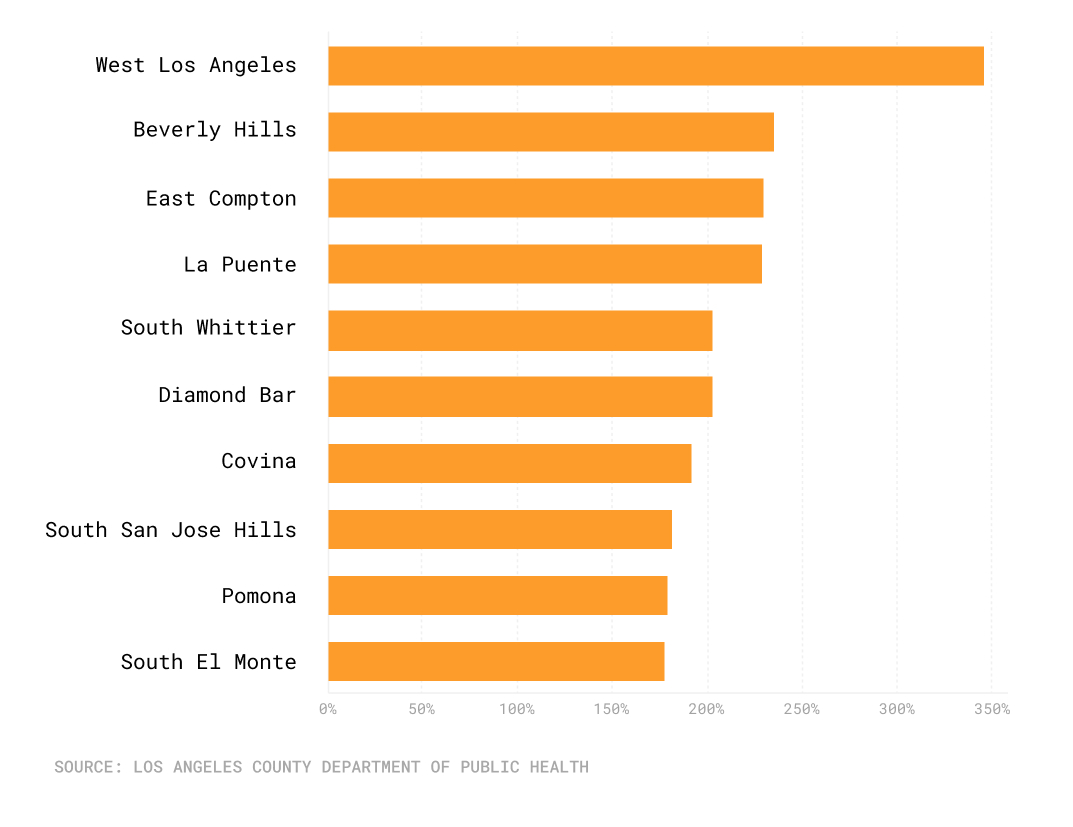
Chart measures the percent change of new cases from May to June for Los Angeles County areas that registered at least 100 new confirmed COVID-19 infections.
However, there are also numerous areas with dense populations that did not see a spike. The neighborhood of East Hollywood, for example, added 158 new cases in June, a decrease of 26% from May.
There were also wealthy areas that saw sharp increases. Beverly Hills maintained a modest increase in May, with 31 cases. But in June, the city recorded 104 new infections, a jump of 235%.
Another place that recorded a high jump from May to June was Diamond Bar, which had a 203% increase in cases. In contrast, Culver City had a 44% decrease.
Who gets tested
There are many factors that can influence why some areas show high numbers of new cases.
Even the location and accessibility of testing sites can make a difference, said Janet Wojcicki, a professor at the University of California, San Francisco, School of Medicine. For example, the city of Pomona had a 179% increase in new infections in June, with 1,010. The county maintains a large, drive-up testing site at the Fairplex in Pomona, making it easy for nearby residents to get a COVID-19 test.
Wojcicki, who has been studying how certain populations in California are impacted differently by COVID-19, noted that there are lots of holes in the data. On July 7, the Department of Public Health reported that the daily rate for positive coronavirus testing rose to 11.6%. On June 27, the daily rate –– which is calculated by a seven-day average –– was 8.6%.
However, the department only reports on the positive testing rate for the county as a whole, not for individual communities. Wojcicki said that localized data on the percentage of positive tests within specific communities would provide a more detailed understanding of which areas have higher infection rates.
Until June 18, Los Angeles County had a strict shutdown order. Then, the county allowed some retail stores, gyms, restaurants and bars to reopen, albeit with sanitary guidelines. But after a surge in new cases, Governor Gavin Newsom is tightening restrictions again.
“We are in a new chapter of our response, and unfortunately, where we are today is different from where we were two, three or four weeks ago,” Los Angeles County Public Health Director Barbara Ferrer said in a press conference on July 6. “Cases are surging, hospitalizations are increasing, and mostly, this is all a reflection of a lot more community spread. All of us –– businesses, individuals and here at the Department of Public Health –– we have to be willing to take action quickly as our situation has evolved.”
About our localized COVID-19 case data: The case data comes from the Los Angeles County Department of Public Health, which began releasing areas-specific numbers on March 25. This data can also be found on Crosstown’s interactive map, which is updated daily. For the City of Los Angeles, Crosstown uses a library of neighborhood boundaries developed by the Los Angeles Times. In several cases, we modified the neighborhood definitions provided by the Department of Public Health to conform to these boundaries. In several cases, we aggregated smaller areas into larger ones to conform with our boundaries. The revised boundaries may result in totals that, in some cases, vary slightly from numbers published by the county. In addition, because of the method the county uses to release data, there are several neighborhoods within the City of Los Angeles for which we cannot confidently report numbers. There are also several areas in Los Angeles County, including Universal City, Castaic and Northwest Antelope Valley, which are not included in the table below because of our uncertainty about the geographic boundaries used by the county.
| Neighborhood | New Cases in May | New Cases in June |
% change from May to June additions
|
| Avalon | 0 | 6 | N/A |
| Rolling Hills | 0 | 2 | N/A |
| Tujunga Canyons | 0 | 0 | N/A |
| Unincorporated Catalina Island | 0 | 1 | N/A |
| West San Dimas | 0 | 0 | N/A |
| Westlake Village | 0 | 2 | N/A |
| Whittier Narrows | 0 | 0 | N/A |
| Rolling Hills Estates | 1 | 10 | 900.00% |
| Hermosa Beach | 7 | 47 | 571.43% |
| Agoura Hills | 4 | 26 | 550.00% |
| Unincorporated Santa Susana Mountains | 1 | 6 | 500.00% |
| La Verne | 16 | 95 | 493.75% |
| Southeast Antelope Valley | 3 | 16 | 433.33% |
| Irwindale | 2 | 10 | 400.00% |
| Acton | 3 | 14 | 366.67% |
| West Los Angeles | 26 | 116 | 346.15% |
| Manhattan Beach | 14 | 57 | 307.14% |
| Beverlywood | 6 | 23 | 283.33% |
| Beverly Crest | 5 | 19 | 280.00% |
| Century City | 5 | 19 | 280.00% |
| Leona Valley | 2 | 7 | 250.00% |
| Northwest Palmdale | 4 | 14 | 250.00% |
| Beverly Hills | 31 | 104 | 235.48% |
| Vernon | 3 | 10 | 233.33% |
| East Compton | 40 | 132 | 230.00% |
| La Puente | 97 | 319 | 228.87% |
| North Whittier | 19 | 60 | 215.79% |
| South Whittier | 107 | 324 | 202.80% |
| Diamond Bar | 36 | 109 | 202.78% |
| East La Mirada | 14 | 42 | 200.00% |
| San Pasqual | 1 | 3 | 200.00% |
| Westwood | 22 | 65 | 195.45% |
| Covina | 88 | 257 | 192.05% |
| Hancock Park | 17 | 48 | 182.35% |
| South San Jose Hills | 48 | 135 | 181.25% |
| Pomona | 362 | 1010 | 179.01% |
| South El Monte | 68 | 189 | 177.94% |
| El Sereno | 95 | 262 | 175.79% |
| San Dimas | 34 | 92 | 170.59% |
| Jefferson Park | 21 | 56 | 166.67% |
| Shadow Hills | 3 | 8 | 166.67% |
| Sierra Madre | 7 | 18 | 157.14% |
| West Puente Valley | 94 | 237 | 152.13% |
| South Gate | 433 | 1069 | 146.88% |
| West Covina | 250 | 617 | 146.80% |
| Artesia | 27 | 65 | 140.74% |
| Ladera Heights | 5 | 12 | 140.00% |
| Sun Village | 14 | 33 | 135.71% |
| El Segundo | 9 | 21 | 133.33% |
| View Park Windsor Hills | 12 | 28 | 133.33% |
| El Monte | 420 | 975 | 132.14% |
| Azusa | 118 | 272 | 130.51% |
| Valinda | 67 | 154 | 129.85% |
| Highland Park | 116 | 262 | 125.86% |
| Lake View Terrace | 59 | 133 | 125.42% |
| Cheviot Hills | 4 | 9 | 125.00% |
| Woodland Hills | 61 | 137 | 124.59% |
| Norwalk | 312 | 687 | 120.19% |
| Avocado Heights | 27 | 59 | 118.52% |
| Unincorporated Santa Monica Mountains | 11 | 24 | 118.18% |
| Claremont | 28 | 61 | 117.86% |
| Westchester | 33 | 71 | 115.15% |
| Paramount | 233 | 500 | 114.59% |
| Lakewood | 119 | 255 | 114.29% |
| Signal Hill | 30 | 64 | 113.33% |
| Brentwood | 18 | 38 | 111.11% |
| Hollywood | 92 | 192 | 108.70% |
| Redondo Beach | 36 | 74 | 105.56% |
| Carthay | 30 | 61 | 103.33% |
| Westmont | 135 | 273 | 102.22% |
| Baldwin Park | 278 | 562 | 102.16% |
| Santa Fe Springs | 47 | 95 | 102.13% |
| Lennox | 57 | 115 | 101.75% |
| Del Aire | 19 | 38 | 100.00% |
| Palos Verdes Estates | 5 | 10 | 100.00% |
| Ramona | 40 | 79 | 97.50% |
| Mayflower Village | 26 | 51 | 96.15% |
| East Los Angeles | 727 | 1425 | 96.01% |
| Hacienda Heights | 106 | 206 | 94.34% |
| Manchester Square | 13 | 25 | 92.31% |
| Harbor Gateway | 82 | 157 | 91.46% |
| West Adams | 180 | 344 | 91.11% |
| Compton | 444 | 840 | 89.19% |
| Walnut | 27 | 51 | 88.89% |
| Commerce | 66 | 124 | 87.88% |
| La Cañada Flintridge | 15 | 28 | 86.67% |
| Lake Los Angeles | 15 | 28 | 86.67% |
| Whittier | 218 | 401 | 83.94% |
| Glendora | 104 | 191 | 83.65% |
| Valley Glen | 48 | 87 | 81.25% |
| Vermont Vista | 275 | 497 | 80.73% |
| Monterey Park | 92 | 166 | 80.43% |
| Playa Vista | 10 | 18 | 80.00% |
| Montebello | 287 | 513 | 78.75% |
| Lomita | 18 | 32 | 77.78% |
| Gardena | 131 | 231 | 76.34% |
| Malibu | 8 | 14 | 75.00% |
| Huntington Park | 383 | 659 | 72.06% |
| Bel Air | 7 | 12 | 71.43% |
| Florence-Firestone | 442 | 750 | 69.68% |
| Willowbrook | 220 | 373 | 69.55% |
| Encino | 49 | 83 | 69.39% |
| Del Rey | 32 | 54 | 68.75% |
| Tarzana | 102 | 171 | 67.65% |
| Bradbury | 3 | 5 | 66.67% |
| Citrus | 51 | 85 | 66.67% |
| Leimert Park | 30 | 50 | 66.67% |
| Hawaiian Gardens | 65 | 108 | 66.15% |
| Bell Gardens | 229 | 380 | 65.94% |
| Alhambra | 141 | 231 | 63.83% |
| Lancaster | 306 | 501 | 63.73% |
| Mid-Wilshire | 55 | 90 | 63.64% |
| Stevenson Ranch | 19 | 31 | 63.16% |
| Watts | 238 | 388 | 63.03% |
| Florence | 309 | 503 | 62.78% |
| West Hollywood | 51 | 83 | 62.75% |
| Adams-Normandie | 29 | 47 | 62.07% |
| Long Beach | 1323 | 2130 | 61.00% |
| Downey | 542 | 871 | 60.70% |
| Walnut Park | 93 | 149 | 60.22% |
| Charter Oak | 32 | 51 | 59.38% |
| Exposition Park | 142 | 225 | 58.45% |
| Arcadia | 52 | 82 | 57.69% |
| Vermont Square | 347 | 545 | 57.06% |
| South San Gabriel | 30 | 47 | 56.67% |
| Bellflower | 290 | 454 | 56.55% |
| La Crescenta Montrose | 16 | 25 | 56.25% |
| Vermont Knolls | 114 | 178 | 56.14% |
| Rosemead | 88 | 137 | 55.68% |
| Historic South-Central | 338 | 526 | 55.62% |
| Wilmington | 199 | 308 | 54.77% |
| Palms | 63 | 97 | 53.97% |
| Torrance | 128 | 196 | 53.13% |
| Boyle Heights | 618 | 941 | 52.27% |
| Hollywood Hills | 26 | 39 | 50.00% |
| Los Feliz | 40 | 60 | 50.00% |
| Playa Del Rey | 2 | 3 | 50.00% |
| Rancho Dominguez | 8 | 12 | 50.00% |
| Toluca Lake | 10 | 15 | 50.00% |
| West Carson | 42 | 63 | 50.00% |
| Eagle Rock | 93 | 139 | 49.46% |
| South Park | 304 | 453 | 49.01% |
| Mar Vista | 31 | 46 | 48.39% |
| Lynwood | 466 | 689 | 47.85% |
| Bell | 218 | 322 | 47.71% |
| Hawthorne | 226 | 333 | 47.35% |
| Palmdale | 360 | 528 | 46.67% |
| Atwater Village | 22 | 32 | 45.45% |
| Rowland Heights | 89 | 129 | 44.94% |
| Glassell Park | 81 | 117 | 44.44% |
| Harbor City | 66 | 95 | 43.94% |
| Elysian Valley | 39 | 56 | 43.59% |
| Silver Lake | 76 | 109 | 43.42% |
| Central Alameda | 470 | 673 | 43.19% |
| Elysian Park | 7 | 10 | 42.86% |
| Rancho Park | 7 | 10 | 42.86% |
| Fairfax | 233 | 330 | 41.63% |
| West Whittier Los Nietos | 137 | 193 | 40.88% |
| Sherman Oaks | 113 | 158 | 39.82% |
| Porter Ranch | 38 | 53 | 39.47% |
| North Hollywood | 385 | 526 | 36.62% |
| Koreatown | 375 | 511 | 36.27% |
| Mount Washington | 59 | 80 | 35.59% |
| Inglewood | 308 | 417 | 35.39% |
| Mission Hills | 89 | 120 | 34.83% |
| Arlington Heights | 22 | 29 | 31.82% |
| Cerritos | 77 | 101 | 31.17% |
| Maywood | 243 | 317 | 30.45% |
| Harvard Park | 208 | 266 | 27.88% |
| Pico Robertson | 26 | 33 | 26.92% |
| Hyde Park | 97 | 123 | 26.80% |
| Green Meadows | 356 | 446 | 25.28% |
| Carson | 190 | 238 | 25.26% |
| Littlerock | 8 | 10 | 25.00% |
| Marina Del Rey | 4 | 5 | 25.00% |
| Rancho Palos Verdes | 36 | 44 | 22.22% |
| Echo Park | 223 | 272 | 21.97% |
| Venice | 26 | 31 | 19.23% |
| Monrovia | 115 | 137 | 19.13% |
| Canoga Park | 242 | 287 | 18.60% |
| Mid-City | 196 | 232 | 18.37% |
| Pico Rivera | 364 | 428 | 17.58% |
| Harvard Heights | 81 | 95 | 17.28% |
| Glendale | 402 | 465 | 15.67% |
| Winnetka | 155 | 178 | 14.84% |
| Northridge | 194 | 221 | 13.92% |
| Duarte | 62 | 70 | 12.90% |
| Westlake | 606 | 684 | 12.87% |
| Lake Balboa | 124 | 138 | 11.29% |
| University Park | 132 | 146 | 10.61% |
| Burbank | 164 | 181 | 10.37% |
| Alondra Park | 30 | 33 | 10.00% |
| Arleta | 185 | 202 | 9.19% |
| San Fernando | 99 | 108 | 9.09% |
| Tujunga | 56 | 61 | 8.93% |
| Sun Valley | 197 | 214 | 8.63% |
| La Mirada | 128 | 139 | 8.59% |
| Santa Monica | 120 | 130 | 8.33% |
| Northeast Antelope Valley | 18 | 19 | 5.56% |
| Santa Clarita | 407 | 422 | 3.69% |
| Cudahy | 191 | 198 | 3.66% |
| Sunland | 63 | 64 | 1.59% |
| Baldwin Hills/Crenshaw | 109 | 109 | 0.00% |
| Calabasas | 46 | 46 | 0.00% |
| Pacific Palisades | 21 | 21 | 0.00% |
| Van Nuys | 464 | 459 | -1.08% |
| Pico-Union | 357 | 353 | -1.12% |
| Lawndale | 72 | 71 | -1.39% |
| Lincoln Heights | 216 | 207 | -4.17% |
| Altadena | 88 | 83 | -5.68% |
| Chinatown | 16 | 15 | -6.25% |
| San Gabriel | 111 | 104 | -6.31% |
| Downtown | 704 | 652 | -7.39% |
| Pacoima | 546 | 500 | -8.42% |
| East San Gabriel | 46 | 42 | -8.70% |
| Granada Hills | 226 | 196 | -13.27% |
| Sylmar | 527 | 457 | -13.28% |
| La Habra Heights | 7 | 6 | -14.29% |
| Quartz Hill | 19 | 16 | -15.79% |
| North Hills | 334 | 279 | -16.47% |
| West Compton | 24 | 20 | -16.67% |
| West Hills | 97 | 80 | -17.53% |
| Panorama City | 520 | 425 | -18.27% |
| Valley Village | 105 | 84 | -20.00% |
| Chatsworth | 109 | 86 | -21.10% |
| San Pedro | 402 | 312 | -22.39% |
| Reseda | 439 | 330 | -24.83% |
| Pasadena | 528 | 394 | -25.38% |
| East Hollywood | 214 | 158 | -26.17% |
| Studio City | 42 | 30 | -28.57% |
| Temple City | 115 | 81 | -29.57% |
| South Pasadena | 47 | 33 | -29.79% |
| Gramercy Park | 44 | 30 | -31.82% |
| Desert View Highlands | 3 | 2 | -33.33% |
| Castaic Canyons | 21 | 13 | -38.10% |
| San Marino | 12 | 7 | -41.67% |
| Culver City | 95 | 53 | -44.21% |
| Agua Dulce | 8 | 4 | -50.00% |
| Angeles Crest | 2 | 1 | -50.00% |
| Elizabeth Lake | 2 | 1 | -50.00% |
| Hidden Hills | 3 | 1 | -66.67% |
| East Pasadena | 4 | 1 | -75.00% |
| Veterans Administration | 5 | 1 | -80.00% |
| Lopezkagel Canyons | 7 | 1 | -85.71% |
| Industry | 11 | 1 | -90.91% |
| Lake Hughes | 1 | 0 | -100.00% |
| Val Verde | -12 | 2 | -116.67% |
How we did it: We used publicly available data from the Los Angeles County Department of Public Health as the source for our COVID-19 case counts. We aggregated case counts from contiguous or nearby neighborhoods in order to be able to make comparisons of areas with similar populations. Click here to see our coronavirus map, which charts the progress of the virus by neighborhood.
The LACDPH does periodically update past reports with new information, which sometimes causes case counts to fluctuate. Those revised reports do not always automatically become part of the public database. We try to update our reporting when new data becomes available.
Want to know more? Or simply just interested in our data? Email us at askus@xtown.la.


