

In tracking hate, LAPD adds multiple layers to its data


On June 3, just after midnight, a 33-year-old Black man was hit by an assailant wielding a pipe in Los Angeles’s Fairfax neighborhood.
The Los Angeles Police Department concluded that the attack was racially motivated.
It was entered into the records with the code “1514,” signifying the motivation for the aggravated assault: “Bias: Anti-Black or African American.” This was one of 50 instances recorded by the LAPD during the first six months of the year that specifically targeted Black people.
Just 18 months earlier, the official record of the incident would have been much more generic: “hate crime.”
But beginning last year, the LAPD revamped the way it records hate crimes and hate incidents that take place in the city.
Graphic by JD LeRoy
Tracking intolerance
Instead of a one-size-fits-all code, the department expanded how it records crimes and incidents motivated by intolerance to 35 different categories, including anti-Jewish, anti-Asian and anti-transgender. These are the same codes the FBI uses to track “bias-motivated offenses.”
The record-keeping adjustment has created a more precise picture of the climate of intolerance in Los Angeles. Before the change, there was no way to see in the LAPD data which groups were being targeted and who was most at risk.
“It’s incredibly important that we have codes about the bias motivation of the offender,” said Brian Levin, director of the Center for the Study of Hate and Extremism at California State University, San Bernardino. “How the hell do you collect hate crime data if you don’t know who is being attacked?”
During the first six months of this year, there were 168 reported hate crimes in the city, 11 more than during the same period in 2019. There were also 47 non-criminal hate incidents; last year, during the same time period, there were 18.
The LAPD catalogues both hate crimes, and non-criminal hate incidents, such as flyers or graffiti containing hate speech. By tracking hate incidents, the department could put more officers in a neighborhood that, for example, might have seen a spate of anti-Jewish incidents, said LAPD hate crime coordinator Det. Orlando Martinez.
“We’re trying to be open, trying to be forward thinking, and we’re trying to be fair,” said Martinez, a 25 year veteran of the department. “Maybe it can increase trust.”
Fraught community-police relationship
But, if advocates’ responses to a recently announced expansion of LAPD’s community policing program are any indication, increasing trust is an uphill battle.
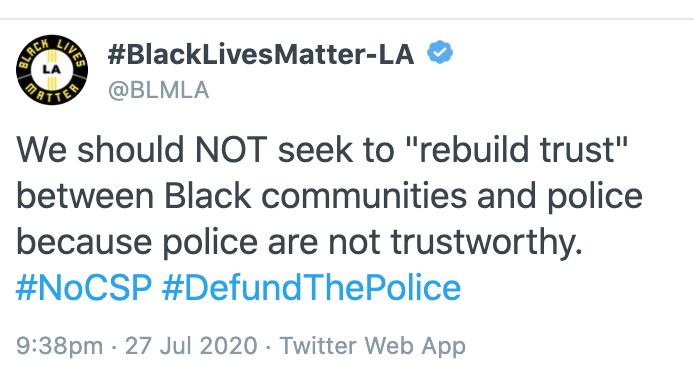
The LAPD is contending with a crisis in public confidence and calls to dismantle its $1.8 billion operational budget. The city council has begun to take the first steps, voting to reallocate $150 million of that money elsewhere. During recent demonstrations against police brutality sparked by the killing of George Floyd at the hands of officers in Minneapolis, the LAPD clashed violently with protestors. Video showed officers swinging batons at some, firing foam rounds into crowds and, in one instance, ramming a patrol car into a pedestrian.
For more than 20 years, the department has existed under the shadow of the 1992 uprisings sparked by the brutal beating of Rodney King and the subsequent acquittals of the four charged officers. The recent protests were an eerie reminder of that historic mistrust.
Hate crimes go unreported
Hate crimes are notoriously under-reported. A national survey by the U.S. Bureau of Justice Statistics estimated that less than half of all hate crimes were reported to the police.
One of the reasons people don’t report is that they do not trust the police will do anything about it, said the Center for the Study of Hate and Extremism’s Levin.
As a result, the very groups that are the most vulnerable to hate crimes and incidents are often the ones least likely to report them.
Black people were targeted more than any other group, with 50 bias crimes or incidents reported in the first six months of the year.
There were 36 reported crimes or incidents classified as “Anti-Jewish” by the LAPD; 29 were “Anti-Gay (male);” 22 were “Anti-Hispanic,” 14 were “Anti-Asian” and 11 were “Anti-Transgender.”
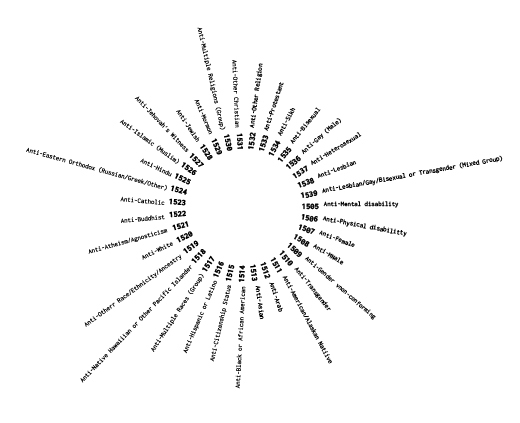
Bias crimes and incidents by category, Jan. 1 – June 30, 2020
Bias: Anti-Black or African American: 50
Bias: Anti-Jewish: 36
Bias: Anti-Gay (Male): 29
Bias: Anti-Hispanic or Latino: 22
Bias: Anti-Asian: 14
Bias: Anti-Transgender: 11
Bias: Anti-Lesbian/Gay/Bisexual or Transgender (Mixed Group): 7
Bias: Anti-White: 6
Bias: Anti-Gender non-conforming: 2
Bias: Anti-Lesbian: 2
Bias: Anti-Other Race/Ethnicity/Ancestry: 2
Bias: Anti-Buddhist: 2
Bias: Anti-Hindu: 2
Bias: Anti-Other Christian: 2
Bias: Anti-Other Religion: 2
Bias: Physical disability: 1
Bias: Mental Disability: 0
Bias : Anti-female: 0
Bias: Anti-male: 0
Bias: Anti-American/Alaskan Native: 0
Bias: Anti-Arab: 0
Bias: Anti-Citizenship Status: 0
Bias: Anti-Multiple Races (Group): 0
Bias: Anti-Native Hawaiian or Other Pacific Islander: 0
Bias: Anti-Atheism/Agnosticism: 0
Bias: Anti-Catholic: 0
Bias: Anti-Eastern Orthodox (Russian/Greek/Other): 0
Bias: Anti-Islamic (Muslim): 0
Bias: Anti-Jehovah’s Witness: 0
Bias: Anti-Mormon: 0
Bias: Anti-Multiple Religions Group: 0
Bias: Anti-Protestant: 0
Bias: Anti-Sikh: 0
Bias: Anti-Bisexual: 0
Bias: Anti-Heterosexual: 0
Hate crimes reveal trends
While hate crimes and incidents account for a fraction of one percent of overall crime, the numbers tell a story about our city and our nation.
“They’re a barometer for trends,” said Levin, who is also a former New York Police Department officer.
Yet the ability of law enforcement agencies to track them varies widely. According to the Brennan Center for Justice, five states — Arkansas, Indiana, North Dakota, South Carolina, and Wyoming — do not even have hate crime laws on their books, making it nearly impossible to get an accurate picture of crimes motivated by prejudice.
In the City of Los Angeles, hate crimes have been steadily increasing. Last year’s total was 326, up 52% since 2015.
“LA counts more hate crimes than any top-10 city in the US per capita,” said Levin. The more data the better, he added. “It is critical for large cities to have these kinds of hate crime units.”
Looking to November
Levin said that during the second half of the year the number of hate crimes may rise. The period after elections, he noted, is often when hate crimes spike.
The day after the 2016 election, he said, “was the worst day in California” for hate crimes since 2003.
He said this year will be one to watch, with a confluence of factors, including President Trump’s divisive language, the persistence of white nationalism and far-right extremism, foreign and domestic groups sowing discord on social media, and, of course, a global pandemic.
“People who are angry, fearful or under stress are more likely to act on hate crimes or be accepting of them,” Levin said.
How we did it: We examined publicly available LAPD data on crimes coded with the bias Modus Operandi or “MO” codes as well as reports of hate crimes from Jan. 1, 2019 – June 30, 2020.
LAPD data only reflects crimes that are reported to the department, not how many crimes actually occurred. In making our calculations, we rely on the data the LAPD makes publicly available.
The LAPD periodically updates past crime reports with new information, leading the department to recategorize past reports. Additionally, revised reports do not always automatically become part of the public database. But, we will keep monitoring hate crimes in the City of Los Angeles.
Want to know how your neighborhood fares? Or simply just interested in our data? Email us at askus@xtown.la.


