

What happened with crime during COVID-19?


As the coronavirus spread through Los Angeles, and the city went into lockdown this spring, crime began to fall, but the impact was more pronounced in some areas than others.
In March, at the beginning of the safer-at-home order, there were 20% fewer crimes reported than during the same month in 2019, according to publicly available data from the Los Angeles Police Department. And that trend continued through September: During the first nine months of this year, the City of Los Angeles recorded a drop of almost 10% compared with the same period a year ago.
Crime in Los Angeles by month 2019 vs. 2020
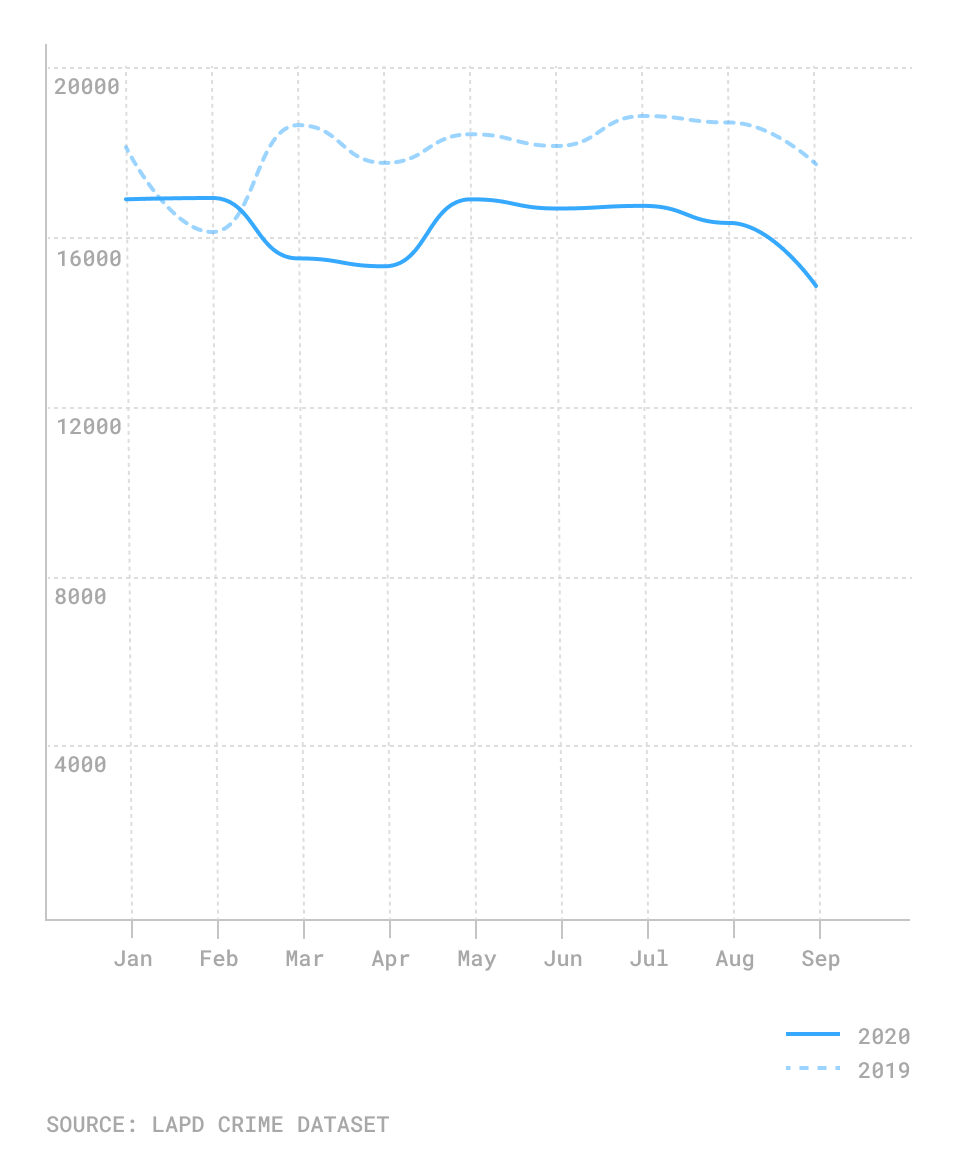
But some crime categories, including murder and car theft, had steep gains.
“With so many people staying home, most crime categories dropped,” said Capt. Paul Vernon, who runs the LAPD’s CompStat department, which analyzes crime data. “Exceptions to that were business burglaries, because stores were unattended for so long, and car theft, possibly because people were parking their cars for long periods and not driving them.”
In fact, June had the highest number of car thefts in the city, at 2,142, in at least a decade. In July, there were 40 homicides, also the highest monthly tally in at least a decade.
[Related: A spike in murders during COVID-19]
Hate crimes, in which a victim is targeted because of their race, gender or other characteristic, were also up, and the city is on track to break last year’s record high.
Assaults, including battery and assault with a deadly weapon, initially took a dip when the shutdown orders went into effect. But since then they have crept back up to nearly last year’s levels.
Assaults in Los Angeles by month 2019 vs. 2020
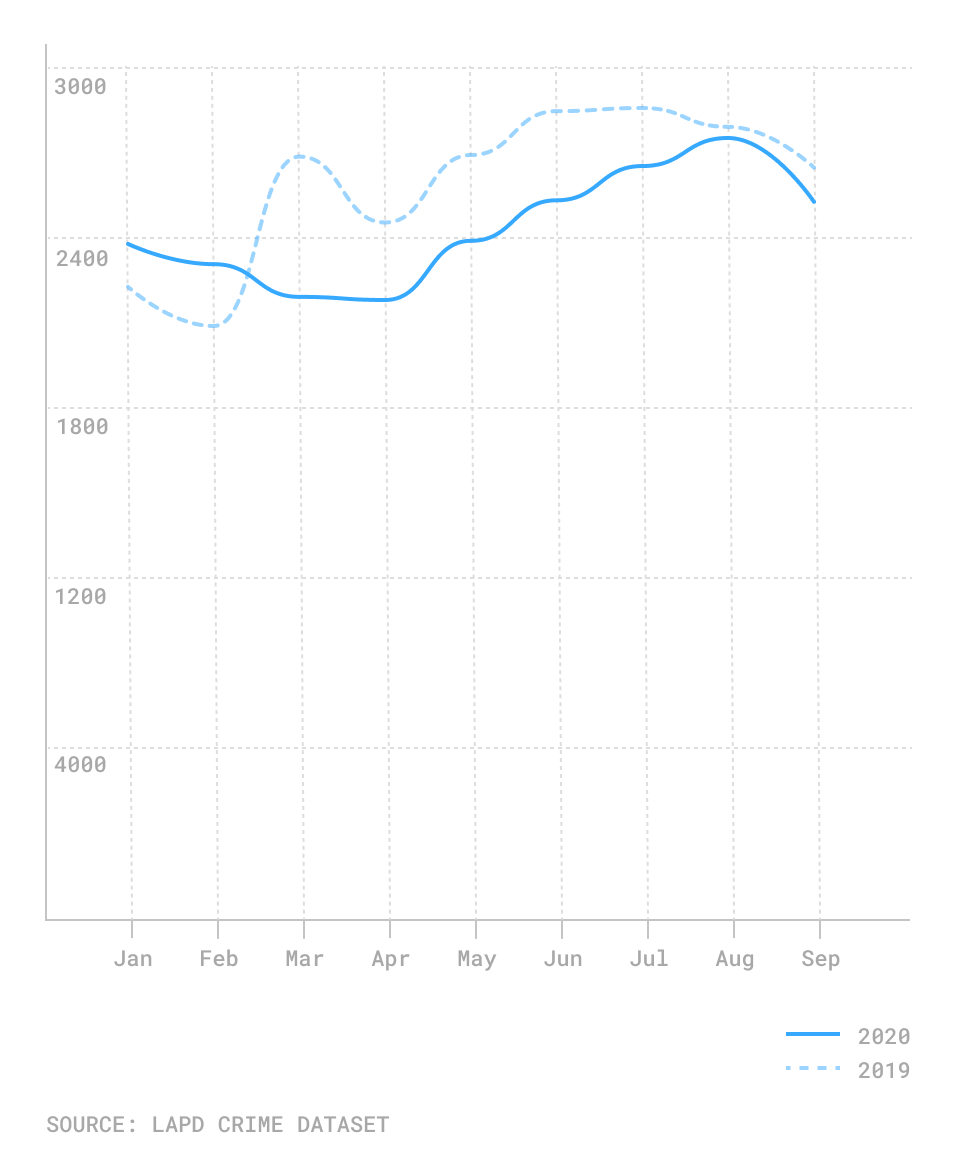
(Includes battery, simple assault ands aggravated assault)
And while the vast majority of the city did experience a drop in crime, 15 neighborhoods reported a rise of at least 1%. Those included wealthy enclaves like Bel-Air, which recorded 200 crimes between January and September this year, up from 119 during the first nine months of last year, a rise of more than 40%. Pacific Palisades, another well-to-do area, had an 8% rise.
Eight neighborhoods had virtually no change in the number of reported crimes, while 87 neighborhoods had a drop of 1% or more.
[See our neighborhood list below]
Two of the neighborhoods to see some of the sharpest declines this year were Elysian Park and University Park. Dodger Stadium, located in Elysian Park, remained mostly closed this baseball season due to the pandemic. Similarly, the University of Southern California campus emptied out in March, likely driving down crime in the University Park neighborhood. (Crosstown is based at USC.)
Thyeris Mason is the president of the North Area Neighborhood Development Council, which includes University Park, but also Adams-Normandie and Exposition Park. Parts of that area, she noted, have had an increase in crime. In addition, she said, “Non-emergency response times for the LAPD have increased.”
Car break-ins in Los Angeles by month 2019 vs. 2020
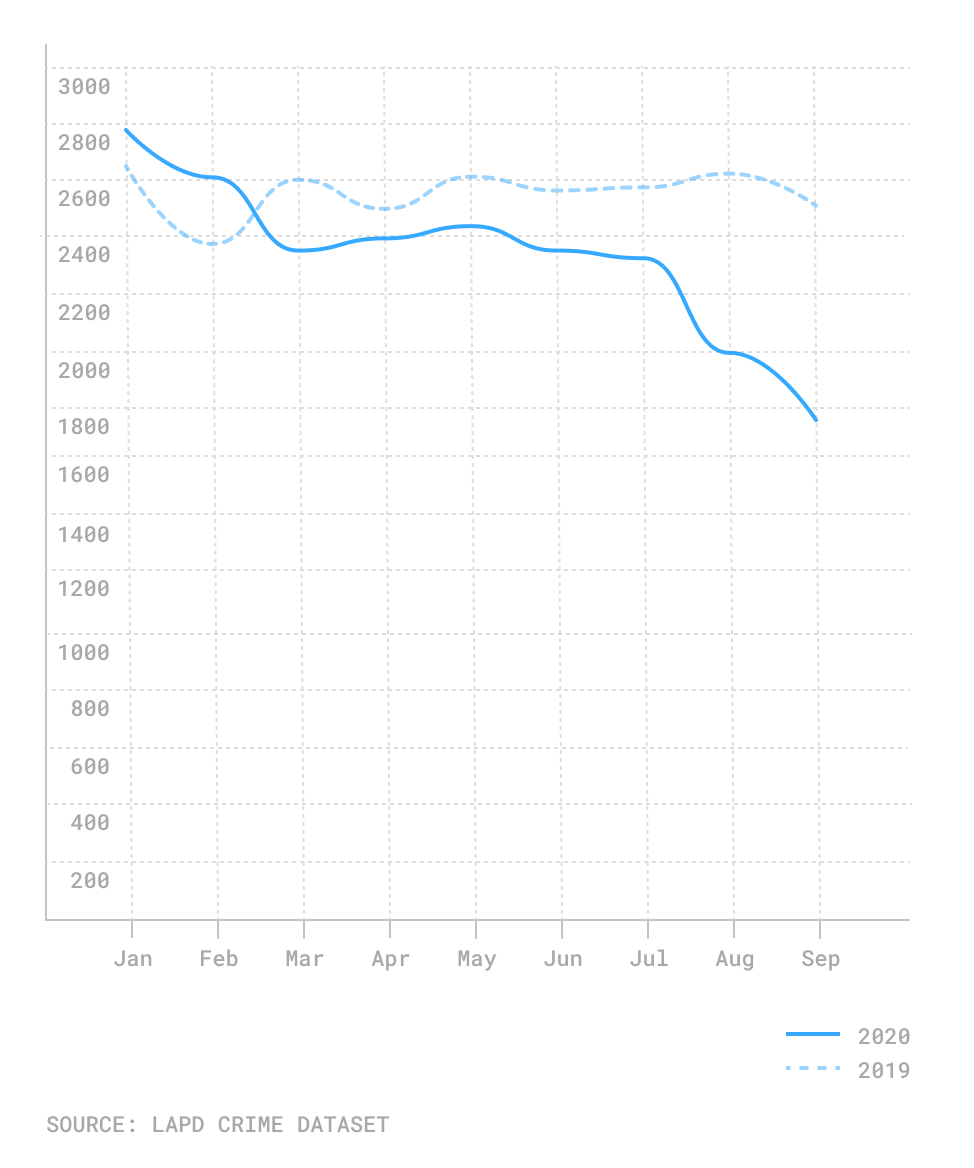
Still, one of the most common types of crime in the city, car break-ins, has had substantial drops this year. In February, before the pandemic hit, there was a 9% increase in reports of car break-ins, when a person either unlocks or forces entry into a vehicle to steal something. But after that, the numbers began to fall, and in September there were 43% fewer reports of car break-ins than during the same month a year ago.
How did your neighborhood fare? Click on the arrows in the table to sort by category. Click once to see the category in ascending order, and again to see it in descending order. You can use the search bar to see how your neighborhood compares to others. The neighborhoods are listed in alphabetical order.
| Neighborhood | Reported crimes Jan.-Sept. 2019 | Reported crimes Jan.-Sept. 2020 | % change |
| Adams Normandie | 693 | 712 | 2.67% |
| Arleta | 607 | 555 | -9.37% |
| Arlington Heights | 762 | 771 | 1.17% |
| Atwater Village | 390 | 350 | -11.43% |
| Baldwin Hills-Crenshaw | 1958 | 1542 | -26.98% |
| Bel-Air | 119 | 200 | 40.50% |
| Beverly Crest | 235 | 179 | -31.29% |
| Beverly Grove | 1484 | 1324 | -12.09% |
| Beverlywood | 153 | 128 | -19.53% |
| Boyle Heights | 3813 | 3466 | -10.01% |
| Brentwood | 805 | 799 | -0.75% |
| Broadway Manchester | 2082 | 1852 | -12.42% |
| Canoga Park | 2846 | 2219 | -28.26% |
| Carthay | 236 | 221 | -6.79% |
| Central Alameda | 1400 | 1329 | -5.34% |
| Century City | 362 | 293 | -23.55% |
| Chatsworth | 1355 | 1245 | -8.84% |
| Chesterfield Square | 513 | 448 | -14.51% |
| Cheviot Hills | 257 | 226 | -13.72% |
| Chinatown | 594 | 532 | -11.65% |
| Cypress Park | 421 | 357 | -17.93% |
| Del Rey | 842 | 744 | -13.17% |
| Downtown | 10865 | 9335 | -16.39% |
| Eagle Rock | 787 | 678 | -16.08% |
| East Hollywood | 2383 | 2240 | -6.38% |
| Echo Park | 1393 | 1219 | -14.27% |
| El Sereno | 923 | 936 | 1.39% |
| Elysian Park | 187 | 132 | -41.67% |
| Elysian Valley | 226 | 155 | -45.81% |
| Encino | 1316 | 1244 | -5.79% |
| Exposition Park | 1935 | 1567 | -23.48% |
| Fairfax | 1210 | 1024 | -18.16% |
| Florence | 2815 | 2701 | -4.22% |
| Florence Firestone | 150 | 157 | 4.46% |
| Glassell Park | 706 | 581 | -21.52% |
| Gramercy Park | 561 | 489 | -14.72% |
| Granada Hills | 1470 | 1274 | -15.39% |
| Green Meadows | 1885 | 1746 | -7.96% |
| Hancock Park | 491 | 453 | -8.39% |
| Harbor City | 714 | 710 | -0.56% |
| Harbor Gateway | 1523 | 1469 | -3.68% |
| Harvard Heights | 844 | 816 | -3.43% |
| Harvard Park | 723 | 595 | -21.51% |
| Highland Park | 1277 | 1224 | -4.33% |
| Historic South Central | 2677 | 2586 | -3.52% |
| Hollywood | 5867 | 4943 | -18.69% |
| Hollywood Hills | 989 | 968 | -2.17% |
| Hollywood Hills West | 559 | 533 | -4.88% |
| hyde park | 1850 | 1480 | -25.00% |
| jefferson park | 956 | 774 | -23.51% |
| Koreatown | 4209 | 3845 | -9.47% |
| Lake Balboa | 691 | 578 | -19.55% |
| Lake View Terrace | 297 | 282 | -5.32% |
| Larchmont | 263 | 263 | 0.00% |
| Leimert Park | 769 | 696 | -10.49% |
| Lincoln Heights | 1106 | 945 | -17.04% |
| Los Feliz | 1070 | 1082 | 1.11% |
| Manchester Square | 733 | 582 | -25.95% |
| Mar Vista | 796 | 813 | 2.09% |
| Mid City | 2062 | 1847 | -11.64% |
| Mid-Wilshire | 1816 | 1515 | -19.87% |
| Mission Hills | 674 | 554 | -21.66% |
| Mount Washington | 258 | 204 | -26.47% |
| North Hills | 1810 | 1582 | -14.41% |
| North Hollywood | 3490 | 3170 | -10.10% |
| Northridge | 2311 | 2043 | -13.12% |
| Pacific Palisades | 461 | 501 | 7.98% |
| Pacoima | 2200 | 2007 | -9.62% |
| Palms | 1168 | 1174 | 0.51% |
| Panorama City | 2259 | 1940 | -16.44% |
| Pico Robertson | 584 | 636 | 8.18% |
| Pico Union | 1960 | 1846 | -6.18% |
| Playa del Rey | 341 | 341 | 0.00% |
| Playa Vista | 401 | 404 | 0.74% |
| Porter Ranch | 467 | 334 | -39.82% |
| Rancho Park | 160 | 163 | 1.84% |
| Reseda | 1987 | 1988 | 0.05% |
| San Pedro | 2676 | 2512 | -6.53% |
| Sawtelle | 1703 | 1595 | -6.77% |
| Shadow Hills | 343 | 289 | -18.69% |
| Sherman Oaks | 2281 | 2013 | -13.31% |
| Silver Lake | 1191 | 1015 | -17.34% |
| South Park | 1595 | 1394 | -14.42% |
| Studio City | 1670 | 1479 | -12.91% |
| Sun Valley | 2663 | 2315 | -15.03% |
| Sunland | 377 | 419 | 10.02% |
| Sylmar | 1868 | 1853 | -0.81% |
| Tarzana | 1290 | 1103 | -16.95% |
| Toluca Lake | 295 | 305 | 3.28% |
| Tujunga | 531 | 634 | 16.25% |
| University Park | 1334 | 920 | -45.00% |
| Valley Glen | 2065 | 1839 | -12.29% |
| Valley Village | 829 | 732 | -13.25% |
| Van Nuys | 4612 | 4213 | -9.47% |
| Venice | 2448 | 2357 | -3.86% |
| vermont knolls | 1525 | 1381 | -10.43% |
| Vermont Slauson | 1880 | 1810 | -3.87% |
| Vermont Square | 2589 | 2350 | -10.17% |
| Vermont Vista | 1522 | 1403 | -8.48% |
| Watts | 2045 | 1766 | -15.80% |
| West Adams | 987 | 819 | -20.51% |
| West Hills | 1035 | 886 | -16.82% |
| West Los Angeles | 432 | 579 | 25.39% |
| Westchester | 2850 | 2276 | -25.22% |
| Westlake | 4767 | 4446 | -7.22% |
| Westwood | 1001 | 944 | -6.04% |
| Wilmington | 2102 | 2185 | 3.80% |
| Windsor Square | 244 | 227 | -7.49% |
| Winnetka | 1396 | 1231 | -13.40% |
| Woodland Hills | 2418 | 2113 | -14.43% |
How we did it: We examined publicly available crime data from the Los Angeles Police Department for the first nine months of 2019 and 2020.
For neighborhood boundaries, we rely on the borders defined by the Los Angeles Times. Learn more about our data here.
LAPD data only reflects crimes that are reported to the department, not how many crimes actually occurred. In making our calculations, we rely on the data the LAPD makes publicly available. LAPD may update past crime reports with new information, or recategorize past reports. Those revised reports do not always automatically become part of the public database.
Want to know how your neighborhood fares? Or simply just interested in our data? Email us at askus@xtown.la.


