

Where the COVID-19 surge is hitting the hardest


(Neighborhoods not drawn to scale.)
The latest COVID-19 surge has swept across Los Angeles County, with a single-day record of 10,528 cases recorded Sunday. But two areas have taken a particularly brutal hit: South Los Angeles and the San Gabriel Valley.
Communities in those areas recorded infection spikes at more than six times the rate of Westwood, and 30 times the rate of Santa Monica or Los Feliz.
Crosstown analyzed the rate of new COVID-19 infections in 270 L.A. County communities over each of the past four weeks. We then compared new cases over the most recent two-week period against the previous two weeks. (To learn more about the methodology, scroll down to the “How we did it” section.)
The results are alarmingly lopsided. Among the 20 communities with the sharpest increase in that period, nine are in South Los Angeles; six are in the San Gabriel Valley.
Top 20 LA communities with the highest increase over the past two weeks
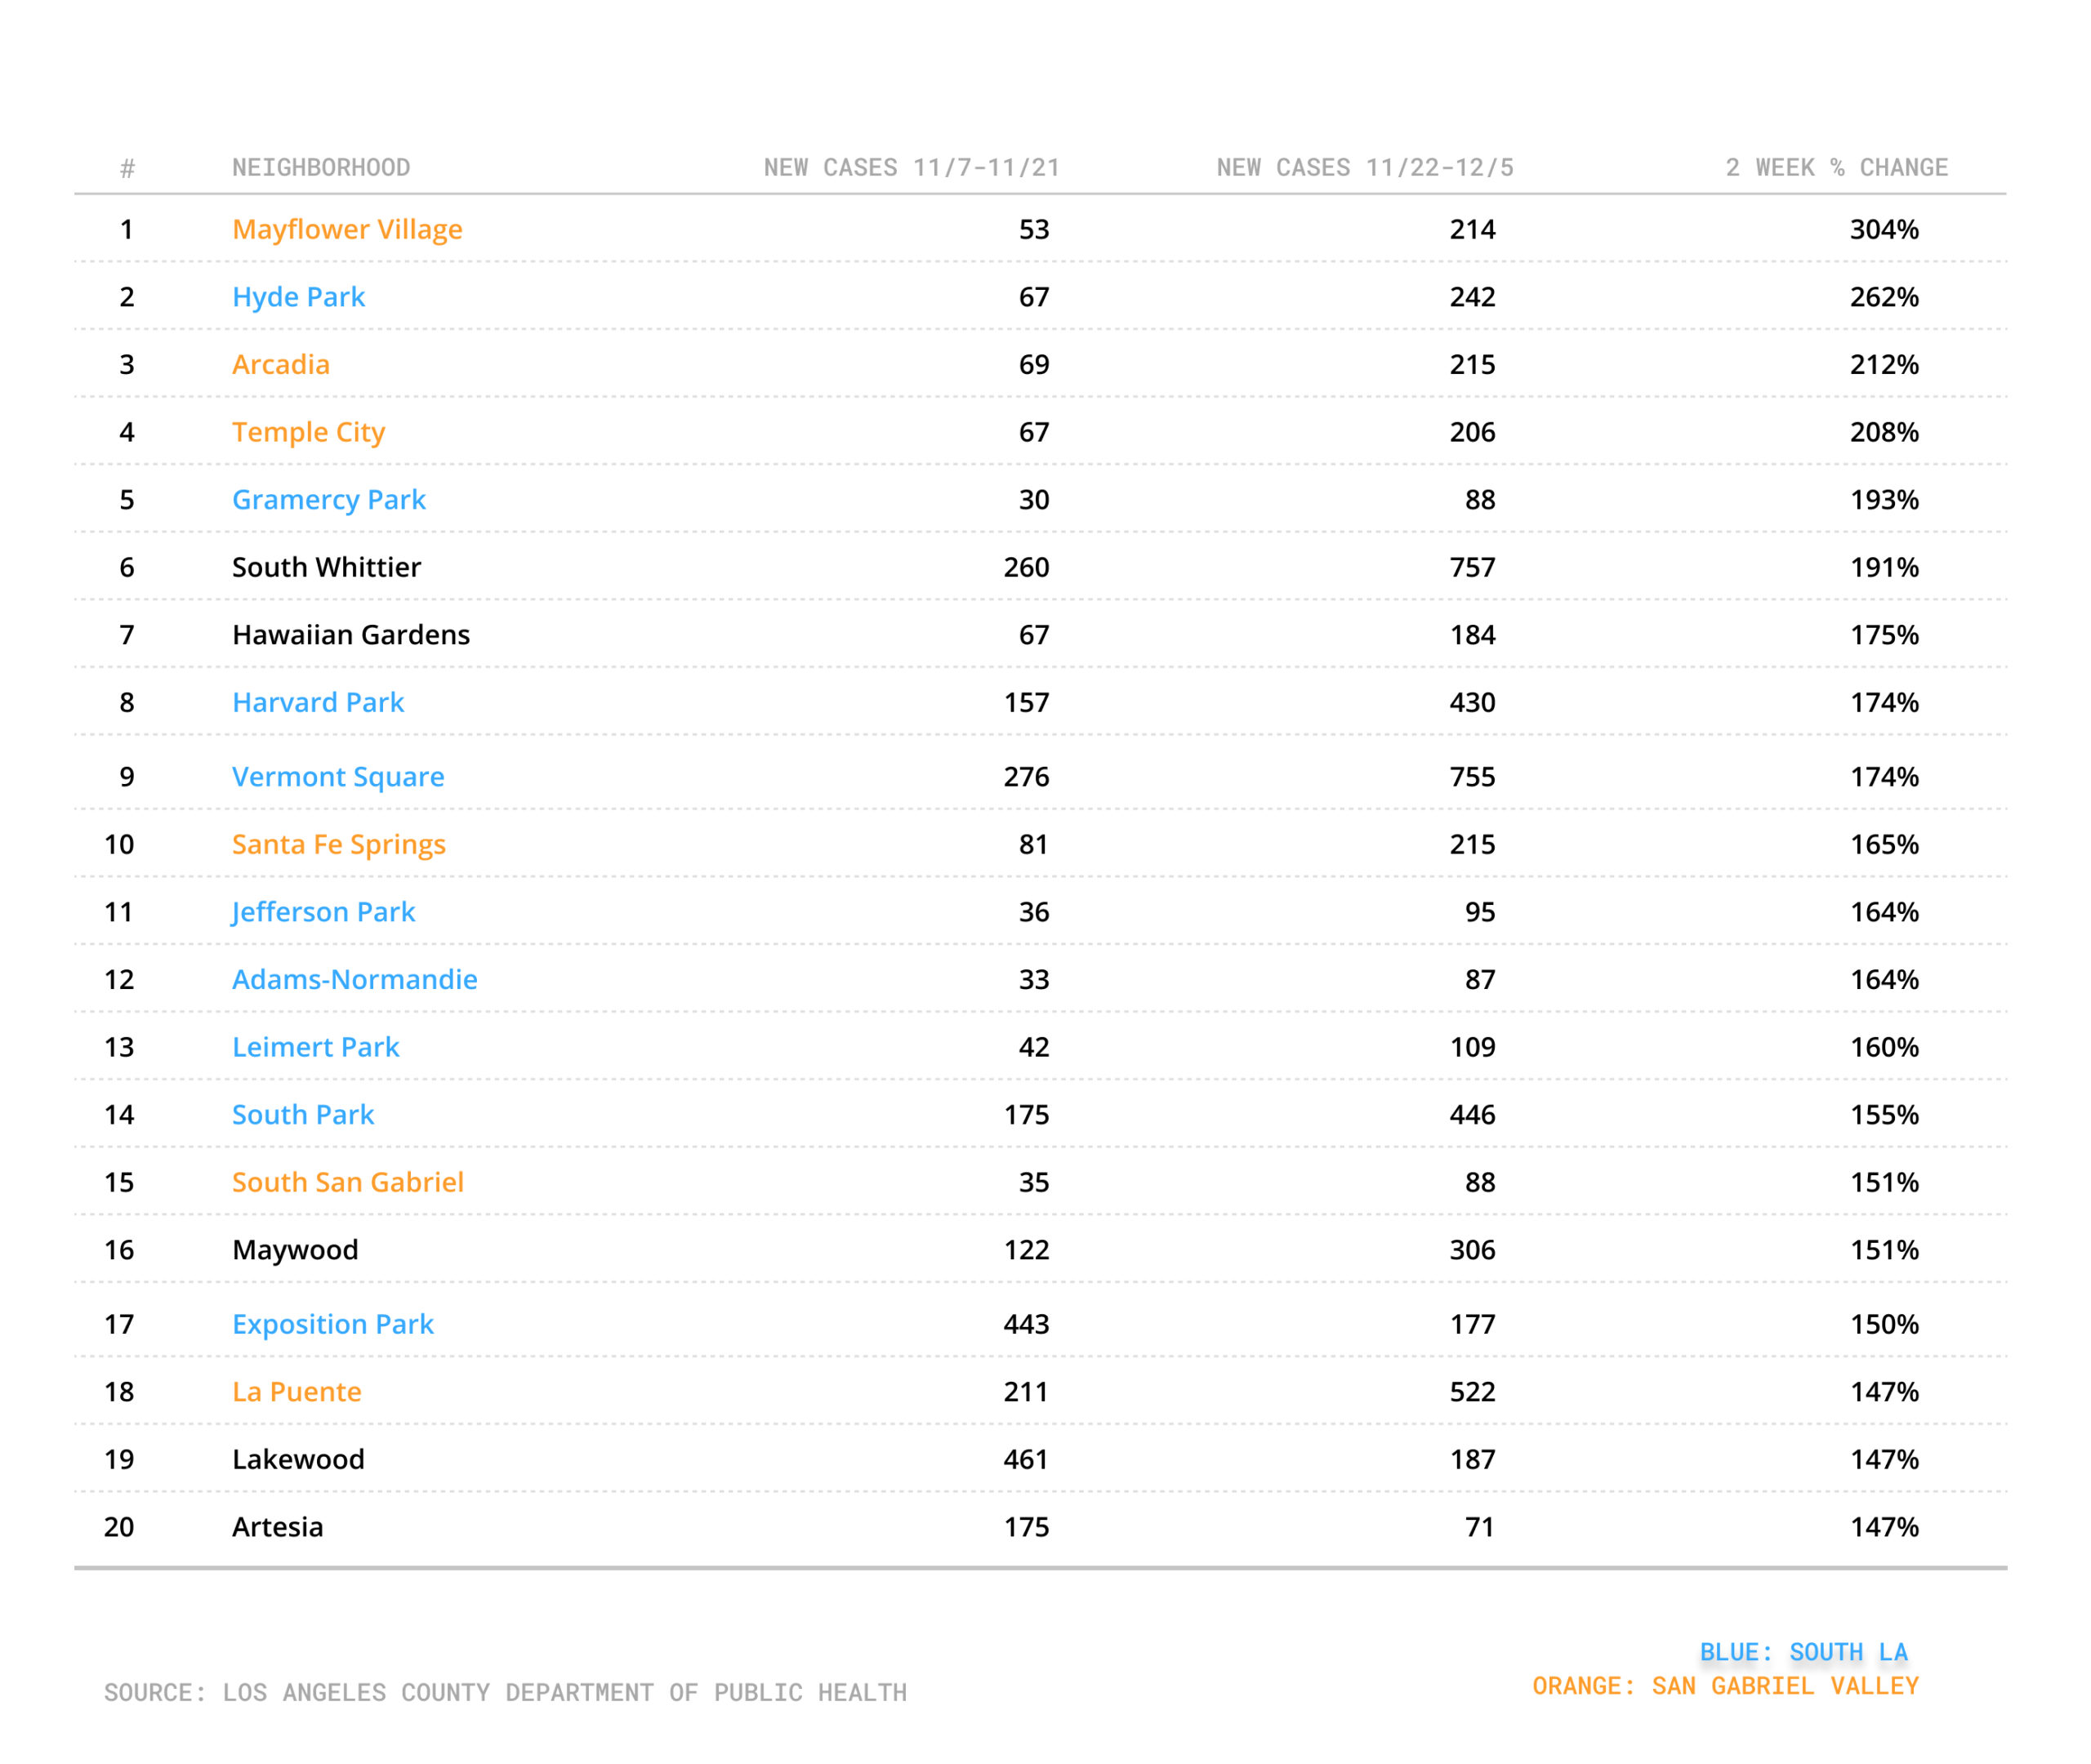
(Los Angeles County Department of Public Health refers to Mayflower Village as unincorporated Duarte.)
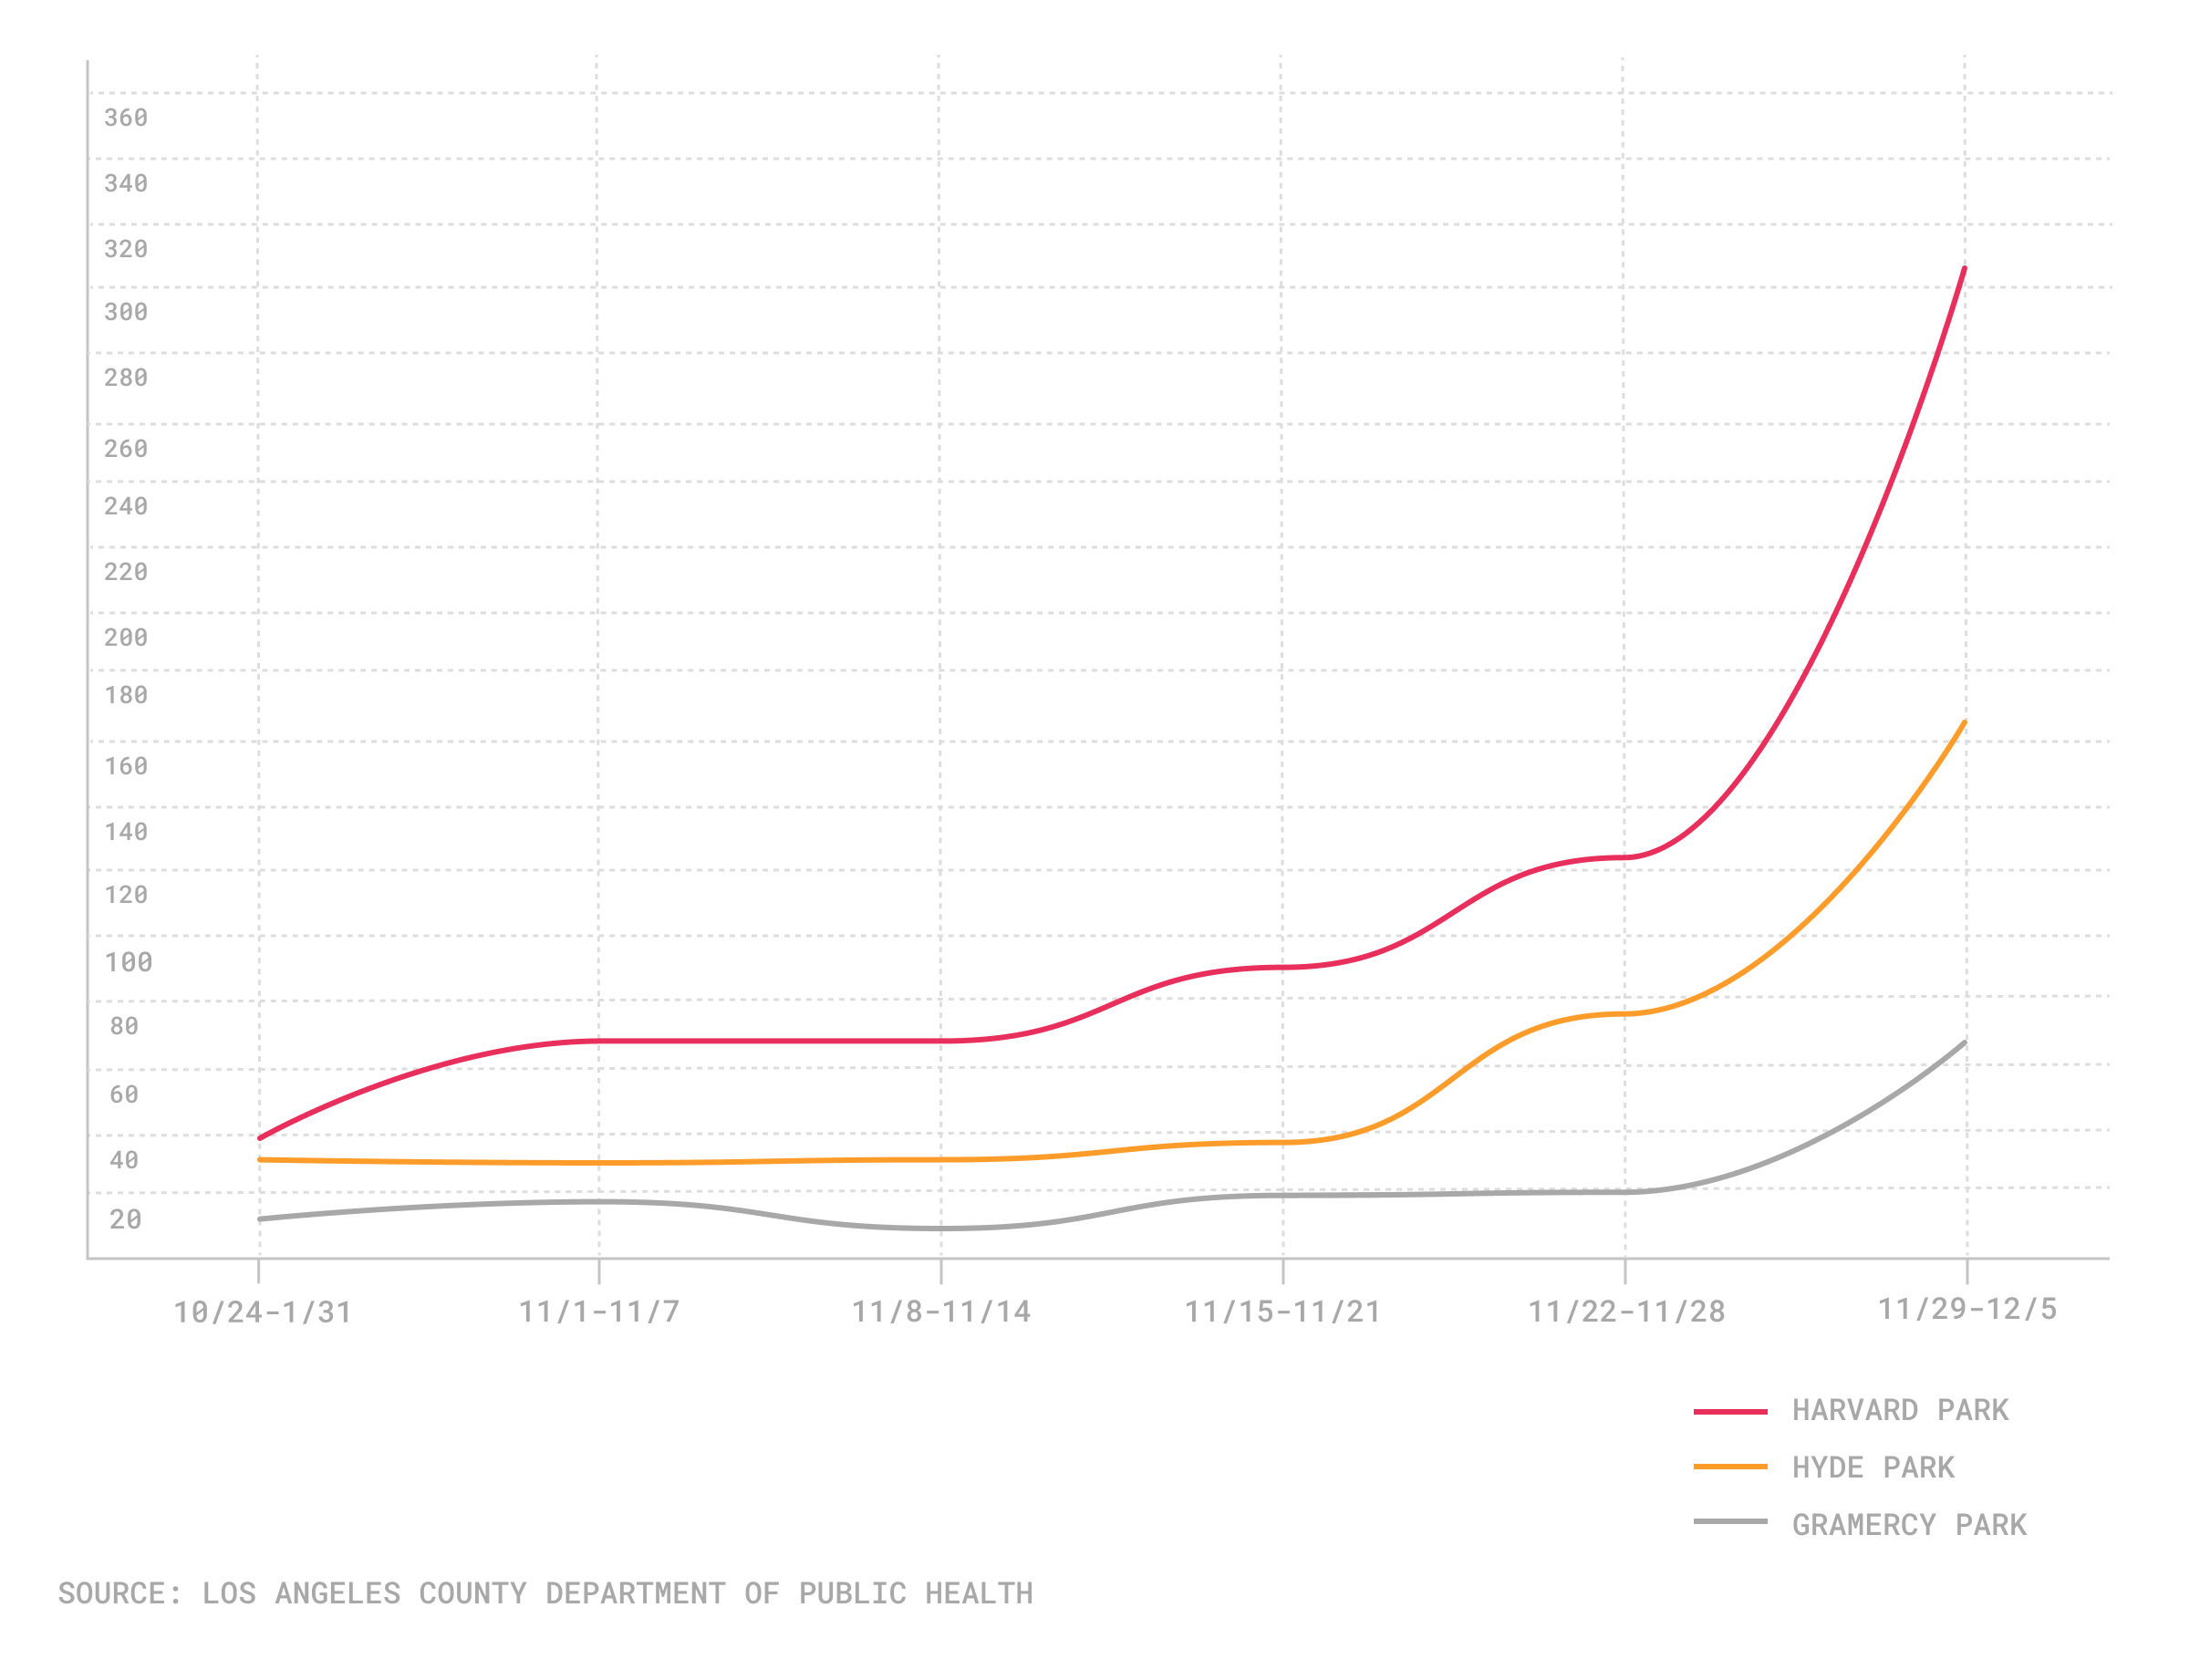
Hyde Park, in South Los Angeles, recorded 66 new cases from Nov. 7-21. During the following two weeks, from Nov. 22-Dec. 5, it had 244 new cases, an increase of 261%.
Rise in weekly COVID-19 cases in three South Los Angeles areas
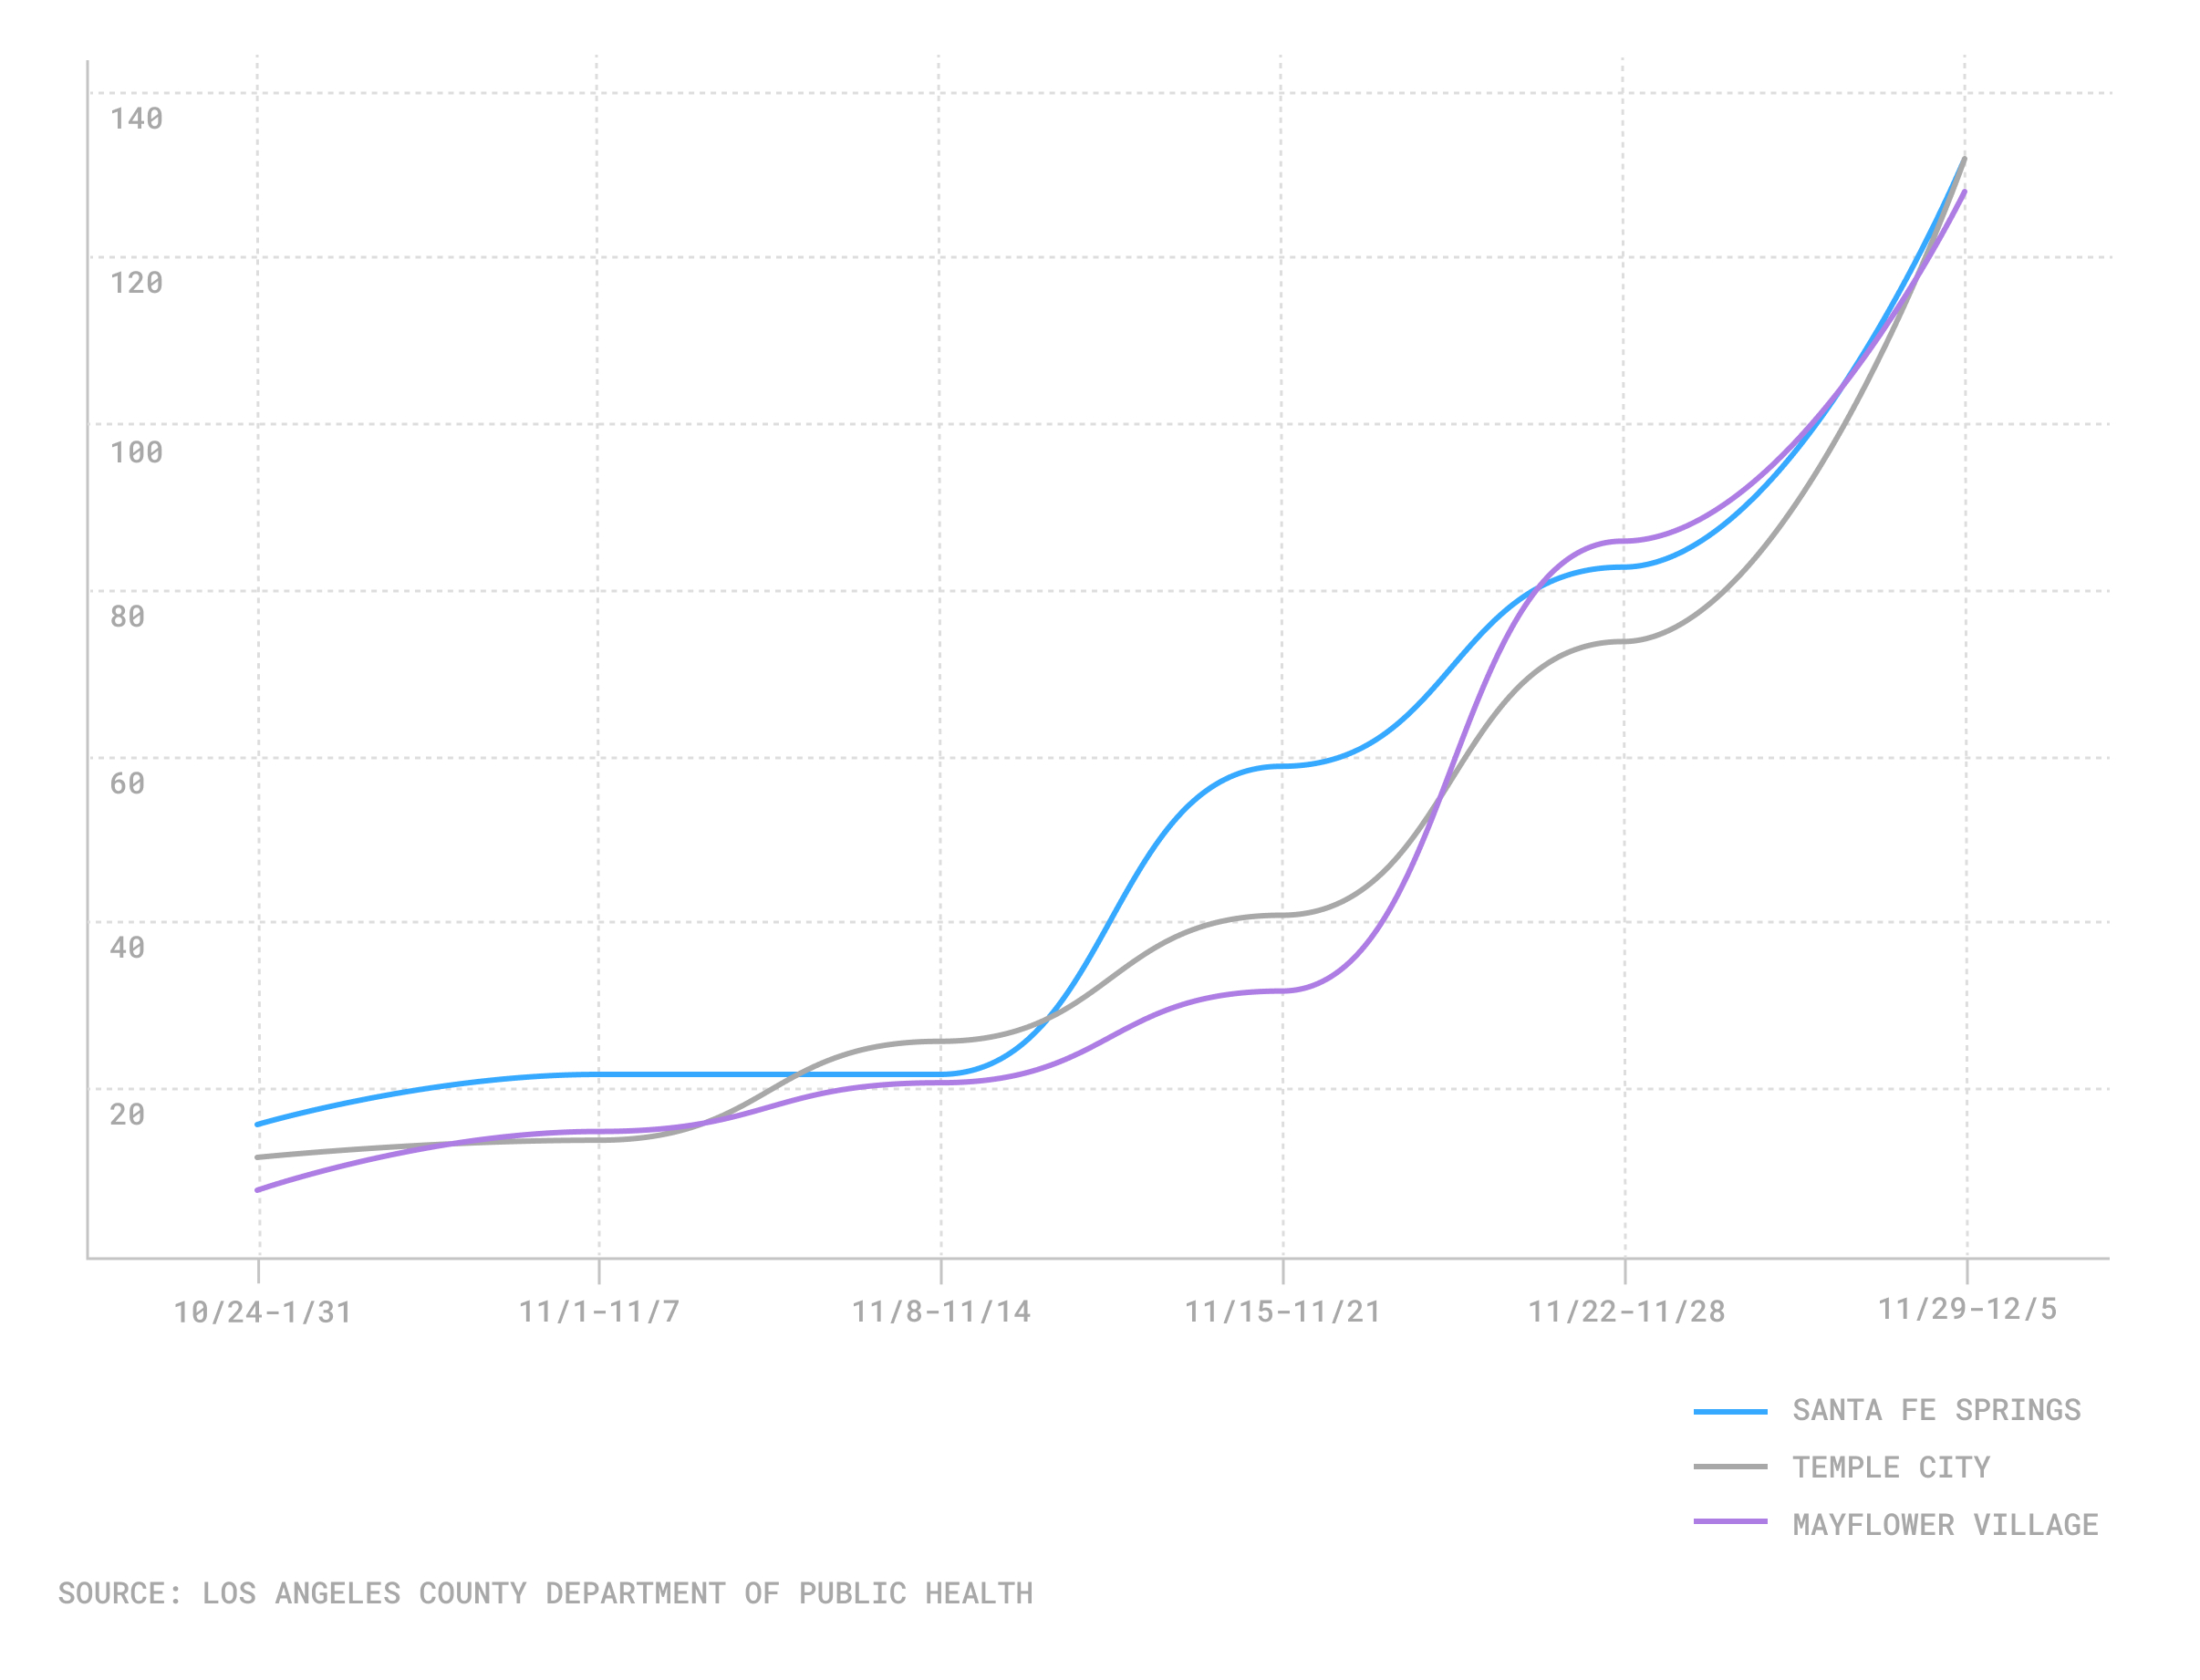
The city of Arcadia had 69 cases in the two weeks between Nov. 7-21. But in the most recent two-week period ending Dec. 5 that number rose to 215 cases.
Rise in weekly COVID-19 cases in San Gabriel Valley communities
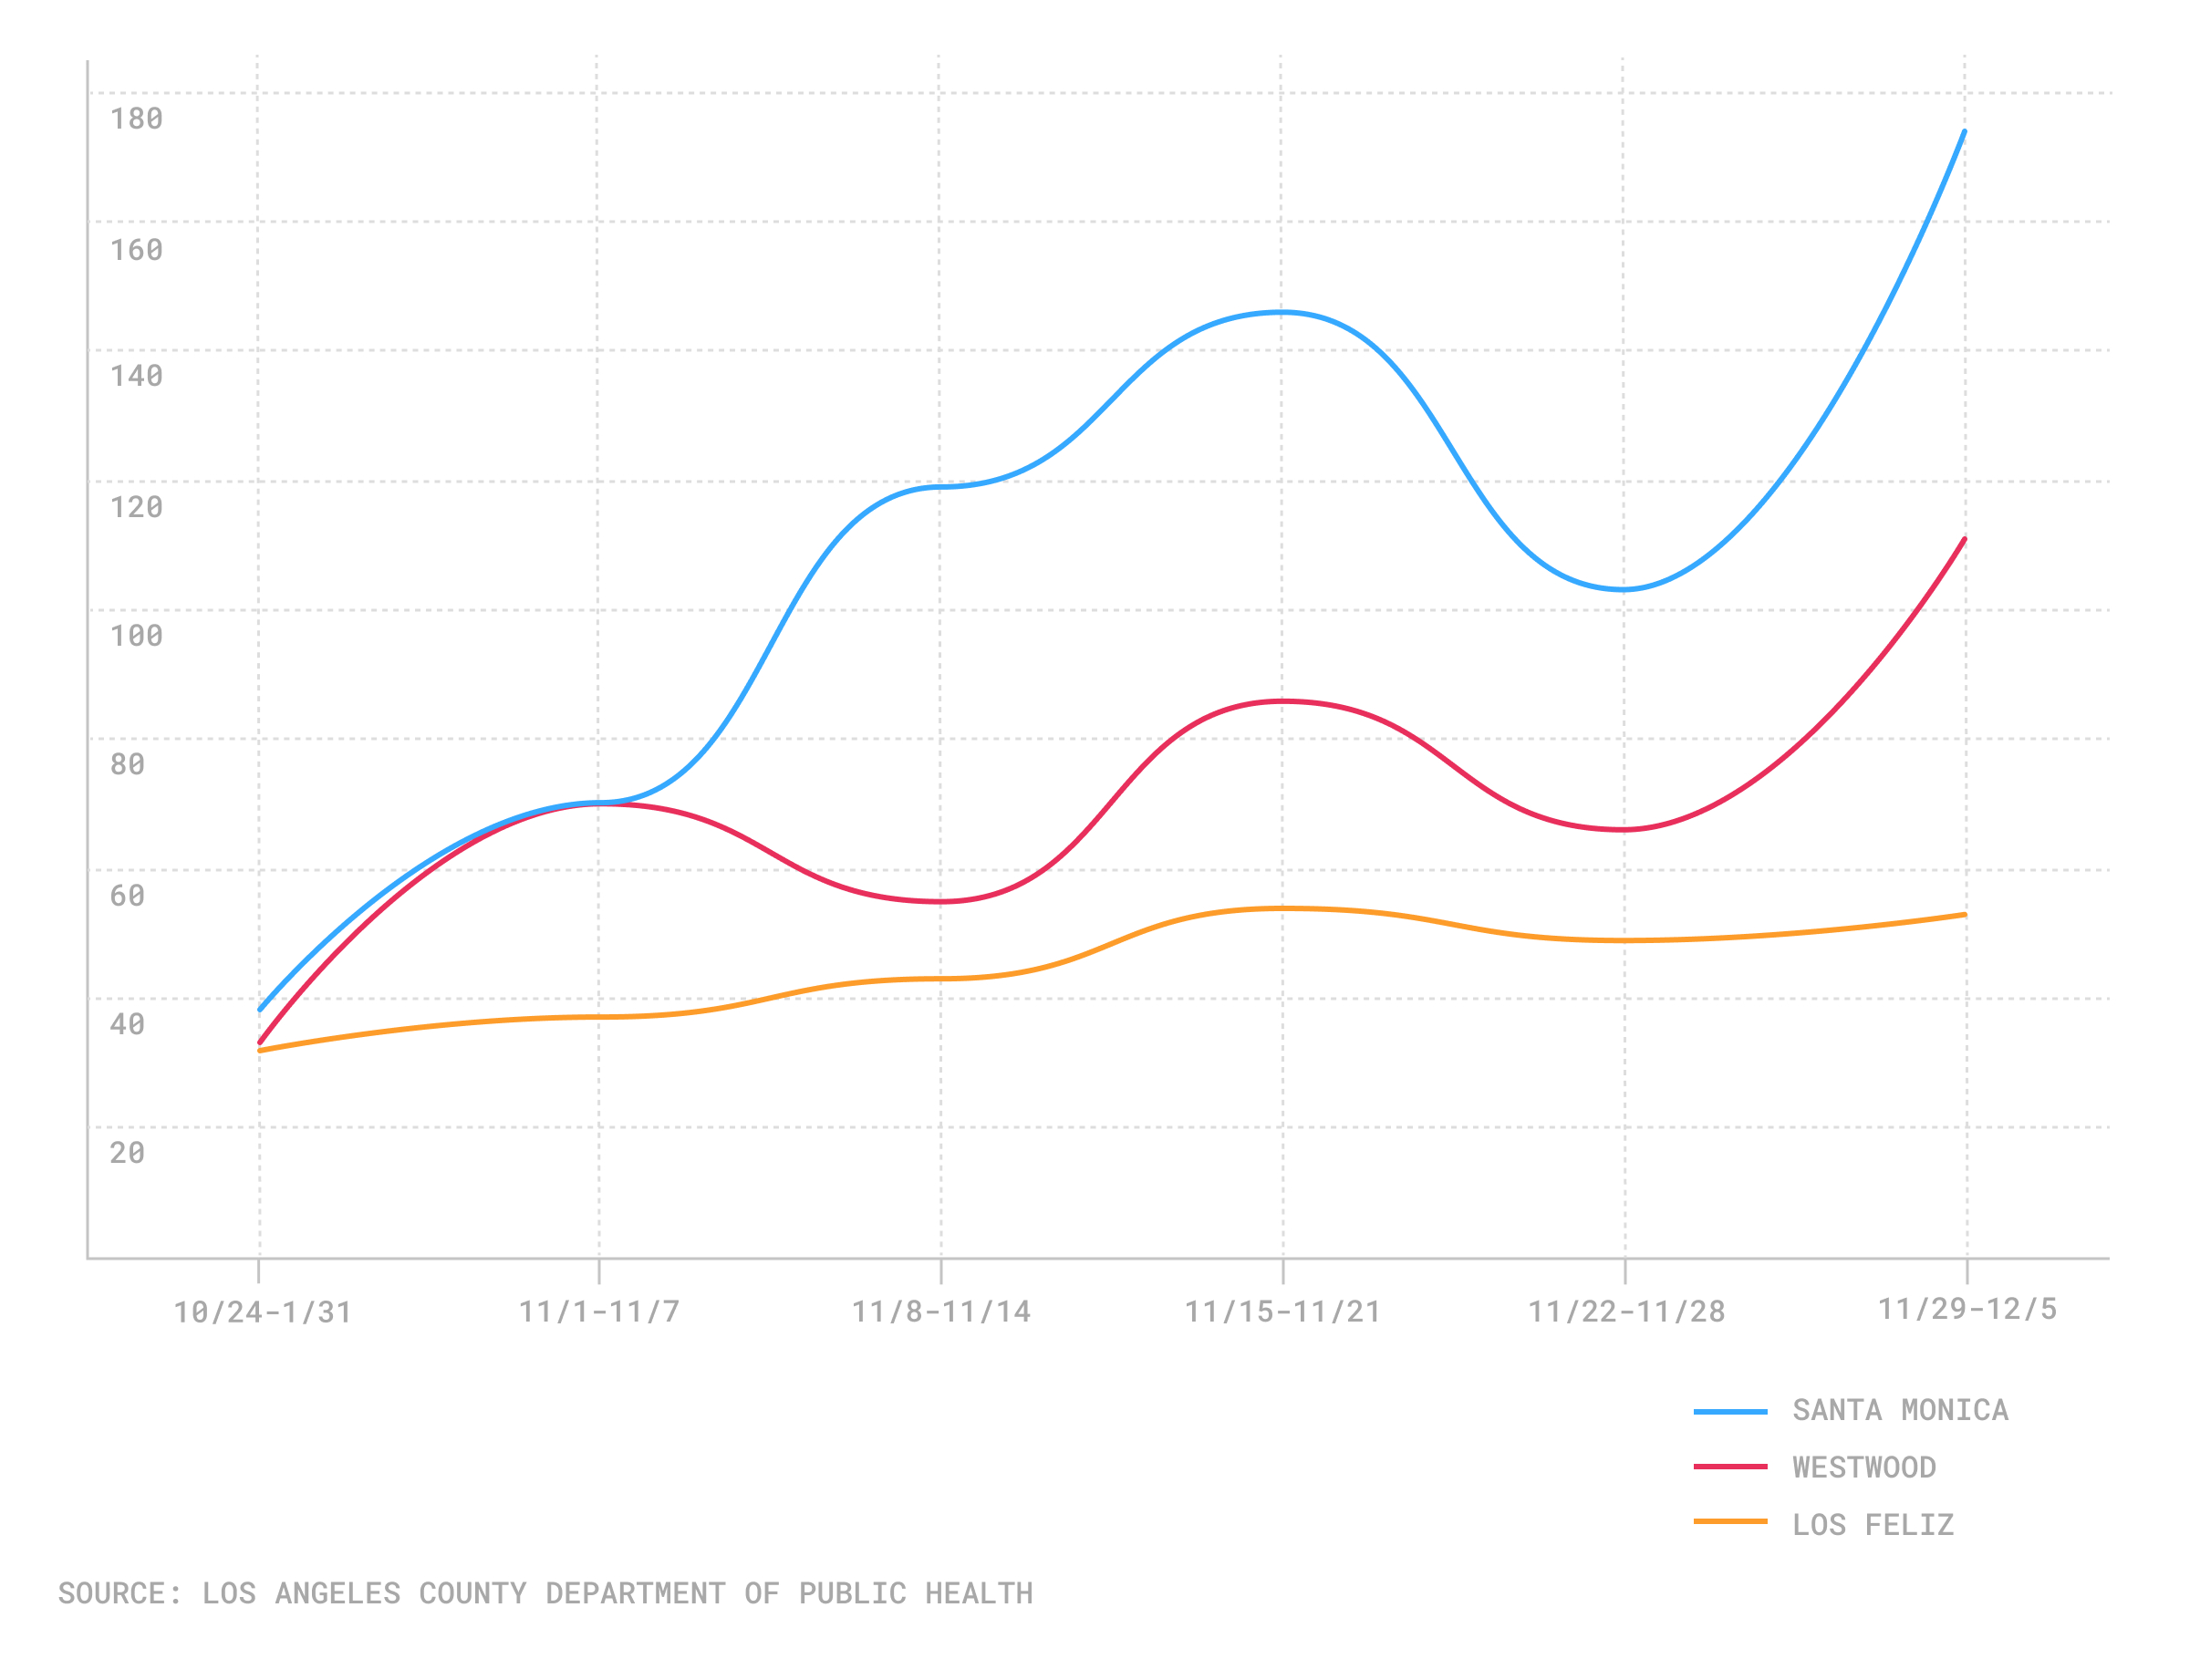
Compare that against Los Angeles County as a whole, which experienced a 91% rise in new cases during that period. Meanwhile, the neighborhood of Los Feliz went from 97 cases during the first two-week period to 102 during the most recent two-week span, an increase of 5.2%. Santa Monica’s new cases also increased by only 5%.
Some areas have not had as sharp a rise in new cases
[Keep track of infection rates in your neighborhood with our interactive map.]
Early on in the pandemic, it became clear that densely populated, low-income areas were increasing their caseload at a faster clip than wealthier neighborhoods. But even now, health officials are often uncertain as to why certain communities experience a spike. Dr. Barbara Ferrer, the director of the Los Angeles County Department of Public Health, warned early last month about high infection rates in Pacoima, Sun Valley and Palmdale. She was unable to pinpoint what had driven the spread in those areas.
Prof. Neeraj Sood, with the Price School of Public Policy at the University of Southern California, said the situation on the ground is changing so rapidly that it is difficult to track.
“I haven’t seen any research that pinpoints the source of transmission,” said Sood, who has been collaborating on several studies with the Los Angeles County Department of Public Health. “It seems like it’s everywhere and you can get it through a variety of different ways.”
Even within one neighborhood, he said, “things can change pretty dramatically and quickly.”
Sood has been conducting a field study at a COVID-19 testing facility in the San Fernando Valley. Just prior to Thanksgiving, his team recorded a positivity rate at the facility of 5-6%. Last week it shot up to 27%.
One factor, said Sood, is that areas that were hit hard during the first wave now have more resistance because those who have already contracted the virus have developed some immunity to it. But places that were only mildly affected during the first months of the virus are now at greater risk.
“Areas where, in the first wave, they were unaffected, now you have 100% of the population that is susceptible,” he said. “Some of that is definitely going on.”
In fact, in March and early April, as COVID-19 first began to spread, some of the highest rates of infection were in wealthy parts of Los Angeles. Residents in those areas were more likely to have been exposed to the virus from travel. In addition, experts noted, wealthy residents had greater access to testing kits before they became available broadly.
Los Angeles County’s seven-day average of new cases is 7,846.
How we did it: We examined publicly available data on daily COVID-19 infections from the Los Angeles County Department of Public Health. We then tallied the number of new infections in 270 communities in the county from Nov. 7-21 and compared that against the new infections recorded between Nov. 22-Dec. 5. We then narrowed our ranking down to communities that recorded 50 or more new infections in the most recent week. That reduced the number of communities we surveyed to 197.
Crosstown uses neighborhood boundaries defined by the Los Angeles Times. In some instances, the Los Angeles County Department of Public Health refers to areas that have different boundaries. We have adjusted our boundaries to conform to the Department of Public Health when possible. In several cases, the department’s boundary definition is unclear. We did not include data for communities when there was uncertainty about the boundary.
Have questions about our data? Write to us at askus@xtown.la.


