

December brings a dizzying COVID-19 death count


The grim spread of COVID-19 is growing ever more dire. The number of deaths in the first 10 days of December represents a more-than 300% increase over that at the beginning of November, a month that already saw the region’s highest total of new cases.
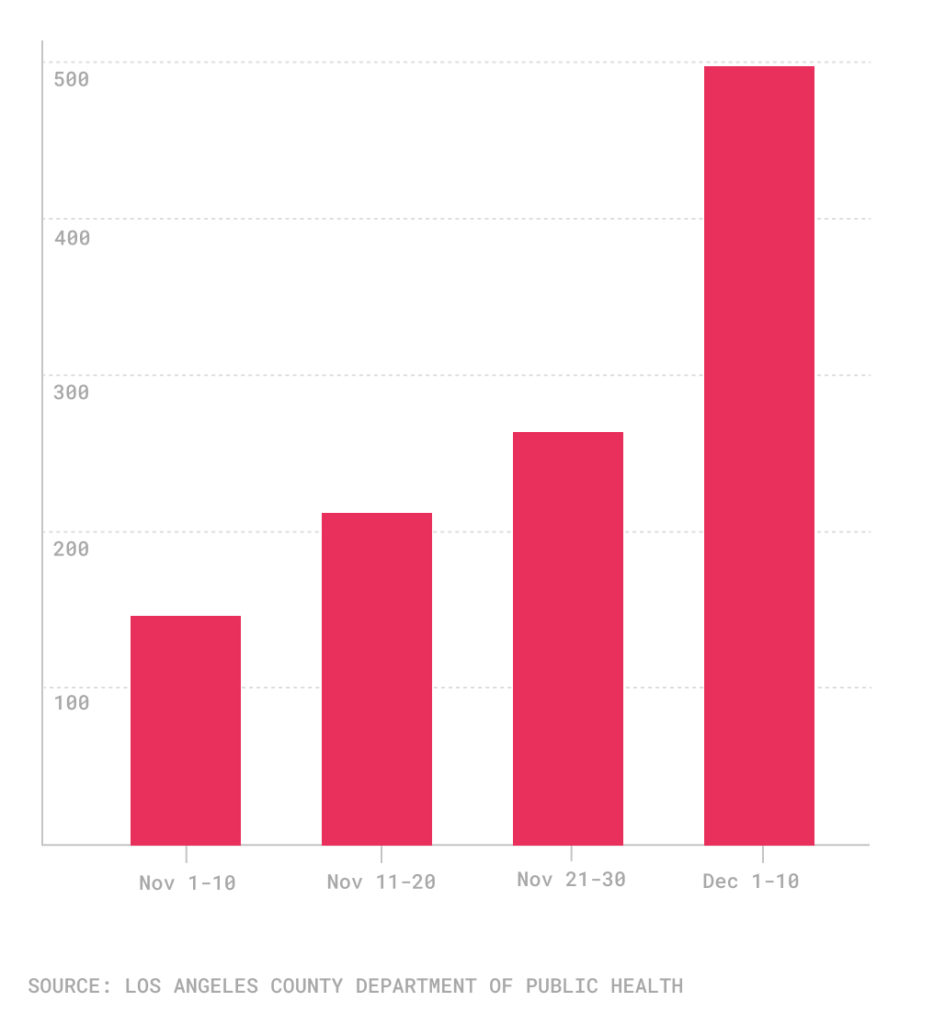
From Dec. 1-10, Los Angeles County recorded 497 deaths from COVID-19, according to the County Department of Public Health. That is more than triple the 146 who died from Nov. 1-10, and nearly double the 264 who succumbed during the previous 10-day period of Nov. 21-30.
COVID deaths in Los Angeles in 10-day increments, Nov. 1-Dec. 10
The rising death toll even brought Dr. Barbara Ferrer, director of the Public Health department, to the verge of tears. During the county’s coronavirus update on Wednesday, she choked up as she noted that the region had reached a painful plateau.
“While this trendline provides a frightening vision of our reality,” she stated as a chart of the rising number of deaths was displayed, “the more terrible truth is that over 8,000 people–.”
She paused, forced out a “Sorry,” and sought to gather herself. It was eight seconds until she was able to continue.
“Over 8,000 people who were beloved members of their families are not coming back, and their deaths are an incalculable loss to their friends and their family, as well as our community,” she finally stated.
The numbers are rising quickly. On Wednesday, the county reported 75 deaths, the single-highest daily tally since July 29. In total, 8,149 people have died, and more than 487,000 cases have been diagnosed in the county.
“In Los Angeles, somebody is dying of COVID-19 every 20 minutes,” Mayor Eric Garcetti said Thursday evening. He previously stated that the number of deaths could pass 11,000 by the end of the year.
Lagging indicator
Making the situation even more troubling is that the death toll does not reflect the magnitude of the current surge in cases. Deaths are a lagging indicator, meaning that after someone contracts the coronavirus, it can be weeks until they need hospital care, and then possibly several additional weeks until an individual passes away. In some instances people die a month or more after being diagnosed.
For most of the first half of November, the county recorded fewer than 2,500 new cases each day. A surge began around Nov. 14, and in the last week of the month, there were from 3,143 to 5,087 new cases.
In the post-Thanksgiving period, the situation has nearly spiraled out of control. The daily new caseload has surpassed 8,000 every day since Dec. 3. Given the lag, this is a pool of people who are likely to need hospital care, or in a worst-case scenario pass away, weeks from now.
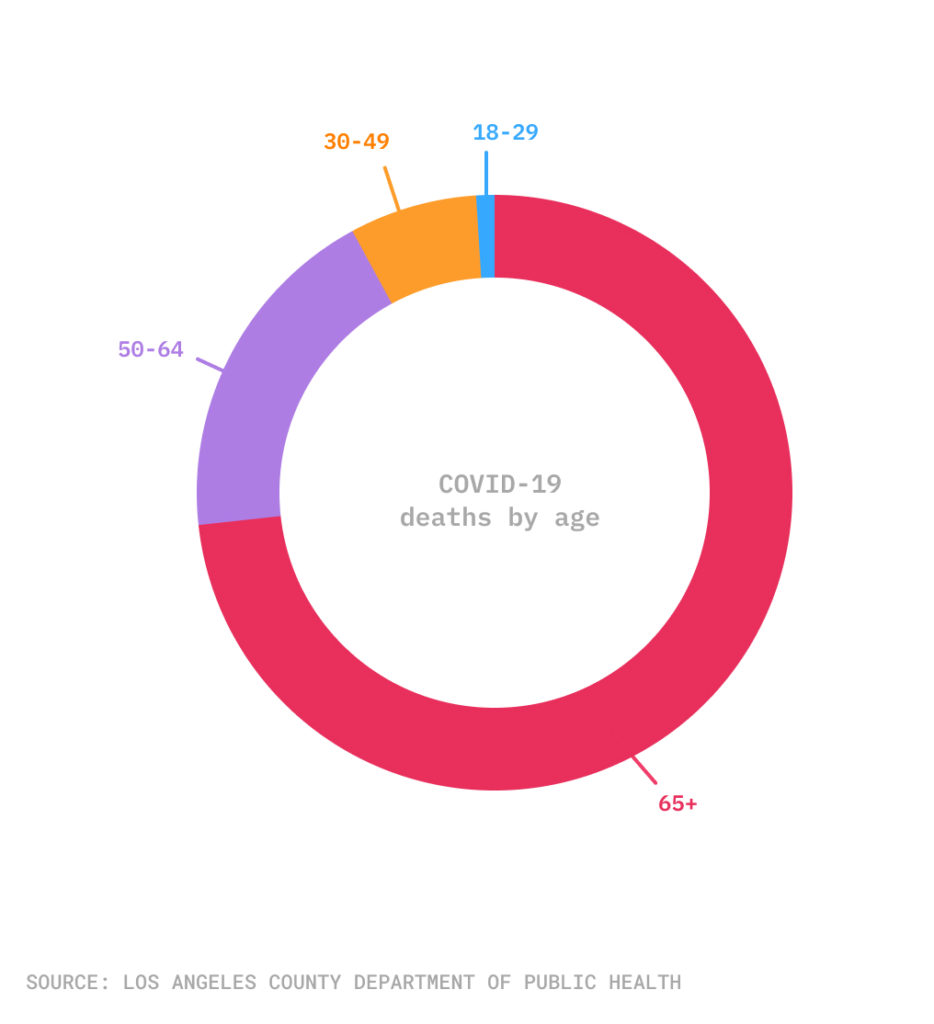
One thing that has not changed since early in the pandemic is the general make-up of those who die. According to the Public Health Department, 93% of those who have passed away had underlying health conditions. Nearly three-quarters of deaths are people over the age of 65, while only about 1% are under 30.
COVID-19 breakdown of deaths by age
Certain ethnic groups continue to be hit particularly hard, though according to county statistics, the rate of death tends to be similar to residential composition. The county’s COVID-19 data dashboard reveals that Latinos, who make up 49.3% of the region’s population, account for 51.8% of deaths. White people have the biggest discrepancy, representing 23.5% of those fallen, and 27.6% of the population. Black people account for 8.2% of the county’s population and 9.3% of COVID-19 deaths. The 14.2% of Asian victims is in line with the community’s 14.5% population make-up.
While the rise in deaths is sparking alarm across the region, according to Garcetti’s publicly available daily data summary, Los Angeles County is, on a proportional basis, experiencing less death than many other populous areas. The Dec. 9 report, citing data from the County Public Health department and John Hopkins University, found that with 79.7 deaths per 100,000 residents, the region ranks 220th out of 584 U.S. counties with a population greater than 100,000.
By contrast, the report says that a quartet of counties in New York and New Jersey have all seen more than 284 deaths per 100,000 residents. That reflects that region’s status as the center of the initial eruption of COVID-19 in the spring.
How we did it: We analyzed daily data provided by the Los Angeles County Department of Public Health. In some cases totals were later changed. We also consulted the daily coronavirus summary prepared by the City of Los Angeles, which uses data collected by the County, John Hopkins University and more.
Interested in our data? Check out the Crosstown coronavirus interactive map or email @askus@xtown.la.


