

With 311 calls, more help is happening


With Angelenos spending long stretches at home during the coronavirus, the number of calls for city services, including some that people might otherwise have handled themselves, has increased. The city’s 311 call center fielded nearly 1.3 million requests for service from January to November, an 8% increase from the 1.2 million during the same time period last year, according to My311 LA data.
My311 Call Volume, 2020 vs. 2019
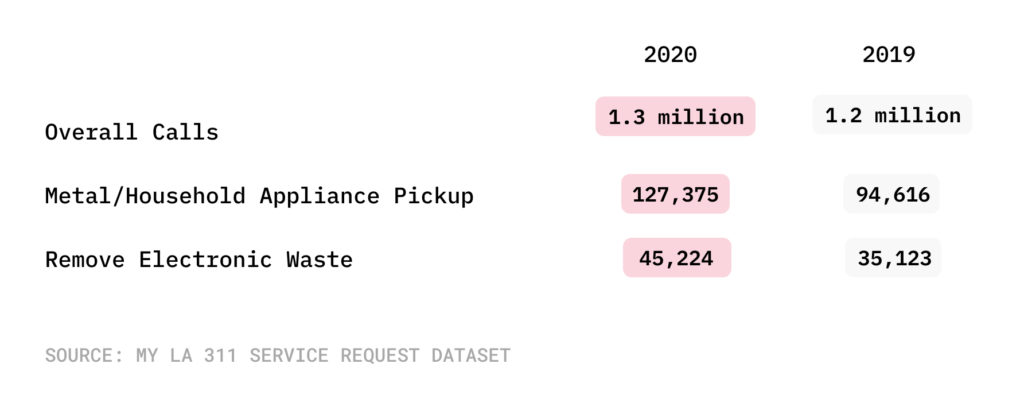
Operators fielded 127,375 calls for the pickup of metal or household appliances, a nearly 35% increase from last year when there were 94,616 requests. There were 45,224 requests to remove electronic waste (everything from computers and monitors to microwave ovens and VCRs), a nearly 29% spike over the 35,123 calls during the same time in 2019.
The increase coincides with a rise in garbage collection from residences, another likely result of people spending more time at home. During the first six months of the year, according to the sanitation bureau, the city collected 11,531.62 tons of garbage. That was a nearly 86% increase from the same time in 2019 and enough trash to fill the Staples Center 167 times.
Historic South-Central recorded the greatest increase in service calls this year; the 36,320 requests to My 311 are 48% more than the 24,571 from January-November 2019. This included 22,935 requests to remove graffiti and 6,897 calls to haul away bulky items.
‘Our fair share of attention’
South Central Neighborhood Council Member-at-Large Azusena Favela said she is happy her neighbors are taking the time to phone in their concerns.
“We deserve our fair share of attention,” Favela said. “There’s definitely an increase in graffiti and furniture and bulky items left on the sidewalk.”
At the same time, Favela pointed to concerns about gentrification and illegal evictions.
“People are getting pushed out of neighborhoods and have to move quickly, so their belongings end up on the sidewalk,” she said. “Folks don’t have a full understanding of the rights they have during the pandemic as far as the moratorium on evictions.”
Other communities with a sizable increase in requests include South Park, where the 13,687 calls represents a 43% boost over last year, and Beverly Crest; there, the 2,233 requests are 42% more than 1,576 during the same timeframe in 2019.
Although most neighborhoods saw an increase in requests, the number of calls for service in Cypress Park fell 18%. The 3,713 requests are down from the 4,532 last year.
One silver lining in 2020 is that operators heard fewer complaints from residents. There were 395 calls related to feedback (defined as tips or suggestions for 311 operators), a decrease of nearly 45% from the 714 calls during the first 11 months of last year.
See how many calls your neighborhood made to My 311 this year by searching below.
| Neighborhood | Total My311 calls Jan.-Nov. 2020 | Total My311 calls Jan.-Nov. 2019 | Total population | % change |
| Historic South-Central | 36,320 | 24,571 | 48700 | 48% |
| South Park | 13687 | 9,549 | 33339 | 43% |
| Beverly Crest | 2233 | 1576 | 11266 | 42% |
| Florence | 22,636 | 16,345 | 52639 | 38% |
| Vermont Slauson | 13,868 | 10,253 | 21634 | 35% |
| Central Alameda | 19700 | 14753 | 43129 | 34% |
| Harvard Park | 5681 | 4277 | 9423 | 33% |
| Cheviot Hills | 1871 | 1413 | 8747 | 32% |
| Beverlywood | 1983 | 1499 | 7244 | 32% |
| Woodland Hills | 19,115 | 14,451 | 67139 | 32% |
| Rancho Park | 2020 | 1528 | 5531 | 32% |
| Porter Ranch | 7999 | 6073 | 26040 | 32% |
| Encino | 11658 | 8980 | 45712 | 30% |
| Green Meadows | 14,546 | 11,303 | 34848 | 29% |
| Leimert Park | 6797 | 5284 | 12566 | 29% |
| West Los Angeles | 4058 | 3162 | 12888 | 28% |
| Beverly Grove | 7,661 | 5,979 | 22023 | 28% |
| Playa Vista | 1696 | 1330 | 11126 | 28% |
| Adams-Normandie | 5940 | 4666 | 17925 | 27% |
| Harbor City | 7634 | 6007 | 25833 | 27% |
| Pacific Palisades | 4657 | 3673 | 24990 | 27% |
| Vermont Square | 24,124 | 19,093 | 26836 | 26% |
| Granada Hills | 17525 | 13958 | 53296 | 26% |
| Bel-Air | 1292 | 1034 | 7615 | 25% |
| Manchester Square | 5650 | 4528 | 11516 | 25% |
| Broadway-Manchester | 12,319 | 9,915 | 28280 | 24% |
| Gramercy Park | 5786 | 4657 | 10666 | 24% |
| Tarzana | 11533 | 9311 | 37739 | 24% |
| Fairfax | 5947 | 4802 | 13484 | 24% |
| Harvard Heights | 8198 | 6633 | 19497 | 24% |
| Watts | 12,171 | 9,848 | 44939 | 24% |
| Mission Hills | 8597 | 6975 | 18747 | 23% |
| Brentwood | 5648 | 4586 | 32865 | 23% |
| Hyde Park | 15889 | 12,914 | 35461 | 23% |
| Mount Washington | 4177 | 3415 | 14201 | 22% |
| Westchester | 10,116 | 8,275 | 41193 | 22% |
| Chatsworth | 15384 | 12611 | 50435 | 22% |
| Vermont Vista | 10110 | 8322 | 49385 | 21% |
| Westwood | 6824 | 5618 | 53050 | 21% |
| Chesterfield Square | 3451 | 2855 | 8247 | 21% |
| Mid-Wilshire | 11574 | 9,610 | 42682 | 20% |
| Winnetka | 15059 | 12510 | 53895 | 20% |
| Shadow Hills | 5102 | 4251 | 12999 | 20% |
| West Hills | 13281 | 11117 | 39299 | 19% |
| San Pedro | 28,755 | 24,096 | 80601 | 19% |
| Northridge | 18,579 | 15,649 | 67555 | 19% |
| Lakeview Terrace | 4221 | 3564 | 13579 | 18% |
| Hollywood Hills West | 3816 | 3242 | 15965 | 18% |
| Panorama City | 20,852 | 17,792 | 70212 | 17% |
| Pico-Robertson | 5718 | 4888 | 18307 | 17% |
| Montecito Heights | 5680 | 4865 | 17724 | 17% |
| Reseda | 23,778 | 20,520 | 71569 | 16% |
| Playa Del Rey | 3398 | 2946 | 11434 | 15% |
| Sherman Oaks | 18,696 | 16,230 | 71575 | 15% |
| Sunland | 5798 | 5036 | 14614 | 15% |
| Venice | 16,699 | 14,515 | 34048 | 15% |
| Lake Balboa | 11007 | 9604 | 27115 | 15% |
| Baldwin Hills/Crenshaw | 8,484 | 7,414 | 29672 | 14% |
| Tujunga | 9463 | 8272 | 27328 | 14% |
| Los Feliz | 10686 | 9345 | 21296 | 14% |
| Mid-City | 20,886 | 18,288 | 51962 | 14% |
| Jefferson Park | 8939 | 7830 | 25339 | 14% |
| Mar Vista | 10183 | 8986 | 37833 | 13% |
| Valley Village | 8545 | 7562 | 25746 | 13% |
| Sun Valley | 30,594 | 27,199 | 71743 | 12% |
| Glassell Park | 8961 | 7967 | 24084 | 12% |
| Exposition Park | 11,959 | 10,641 | 35235 | 12% |
| Silver Lake | 13273 | 11881 | 31189 | 12% |
| Arleta | 13150 | 11777 | 33780 | 12% |
| Sawtelle | 11,643 | 10,466 | 42223 | 11% |
| Palms | 11126 | 10018 | 42746 | 11% |
| Pacoima | 24,258 | 21,846 | 76726 | 11% |
| Downtown | 26,990 | 24,331 | 50085 | 11% |
| Century City | 905 | 816 | 6175 | 11% |
| Harbor Gateway | 15262 | 13802 | 41308 | 11% |
| Echo Park | 18916 | 17171 | 34950 | 10% |
| Studio City | 11529 | 10,552 | 39851 | 9% |
| Carthay | 1697 | 1563 | 5356 | 9% |
| Highland Park | 18039 | 16649 | 53013 | 8% |
| Hancock Park | 3315 | 3077 | 10774 | 8% |
| Canoga Park | 15,947 | 14,812 | 59641 | 8% |
| Lincoln Heights | 9736 | 9071 | 28649 | 7% |
| El Sereno | 13164 | 12290 | 42077 | 7% |
| Arlington Heights | 8031 | 7505 | 23768 | 7% |
| North Hills | 18,146 | 16,963 | 62414 | 7% |
| Boyle Heights | 37,232 | 34,807 | 92036 | 7% |
| University Park | 3116 | 2916 | 24170 | 7% |
| Elysian Park | 1055 | 988 | 2386 | 7% |
| West Adams | 9806 | 9226 | 21328 | 6% |
| Van Nuys | 38,239 | 36,124 | 111635 | 6% |
| Del Rey | 8568 | 8121 | 30010 | 6% |
| Windsor Square | 1376 | 1311 | 6694 | 5% |
| Larchmont | 2684 | 2586 | 8595 | 4% |
| North Hollywood | 31,832 | 30,736 | 81849 | 4% |
| Vermont Knolls | 9114 | 8,832 | 24031 | 3% |
| Koreatown | 29,630 | 28,832 | 107316 | 3% |
| Sylmar | 31,843 | 31,067 | 80327 | 2% |
| Elysian Valley | 2936 | 2874 | 7404 | 2% |
| Atwater Village | 5596 | 5539 | 11206 | 1% |
| Pico-Union | 17,093 | 17,025 | 42187 | 0% |
| Wilmington | 20,440 | 20,440 | 58161 | 0% |
| Westlake | 31,556 | 31,698 | 107760 | 0% |
| Valley Glen | 20,521 | 20,637 | 58495 | -1% |
| Hollywood | 26,648 | 26,807 | 73119 | -1% |
| Chinatown | 4609 | 4677 | 13687 | -1% |
| East Hollywood | 30,876 | 32,828 | 68503 | -6% |
| Eagle Rock | 11129 | 11894 | 34233 | -6% |
| Toluca Lake | 2754 | 2982 | 9192 | -8% |
| Cypress Park | 3713 | 4532 | 9786 | -18% |
How we did it: We examined publicly available My 311 data. For neighborhood boundaries, we rely on the borders defined by the Los Angeles Times. Learn more about our data here.
Want to know how your neighborhood fares? Or simply just interested in our data? Email us at askus@xtown.la.


