The year of parking courageously

The City of Los Angeles issued more than 1.3 million parking tickets last year, a steep drop from the more than 2 million a year it typically issues, according to Los Angeles Department of Transportation data.
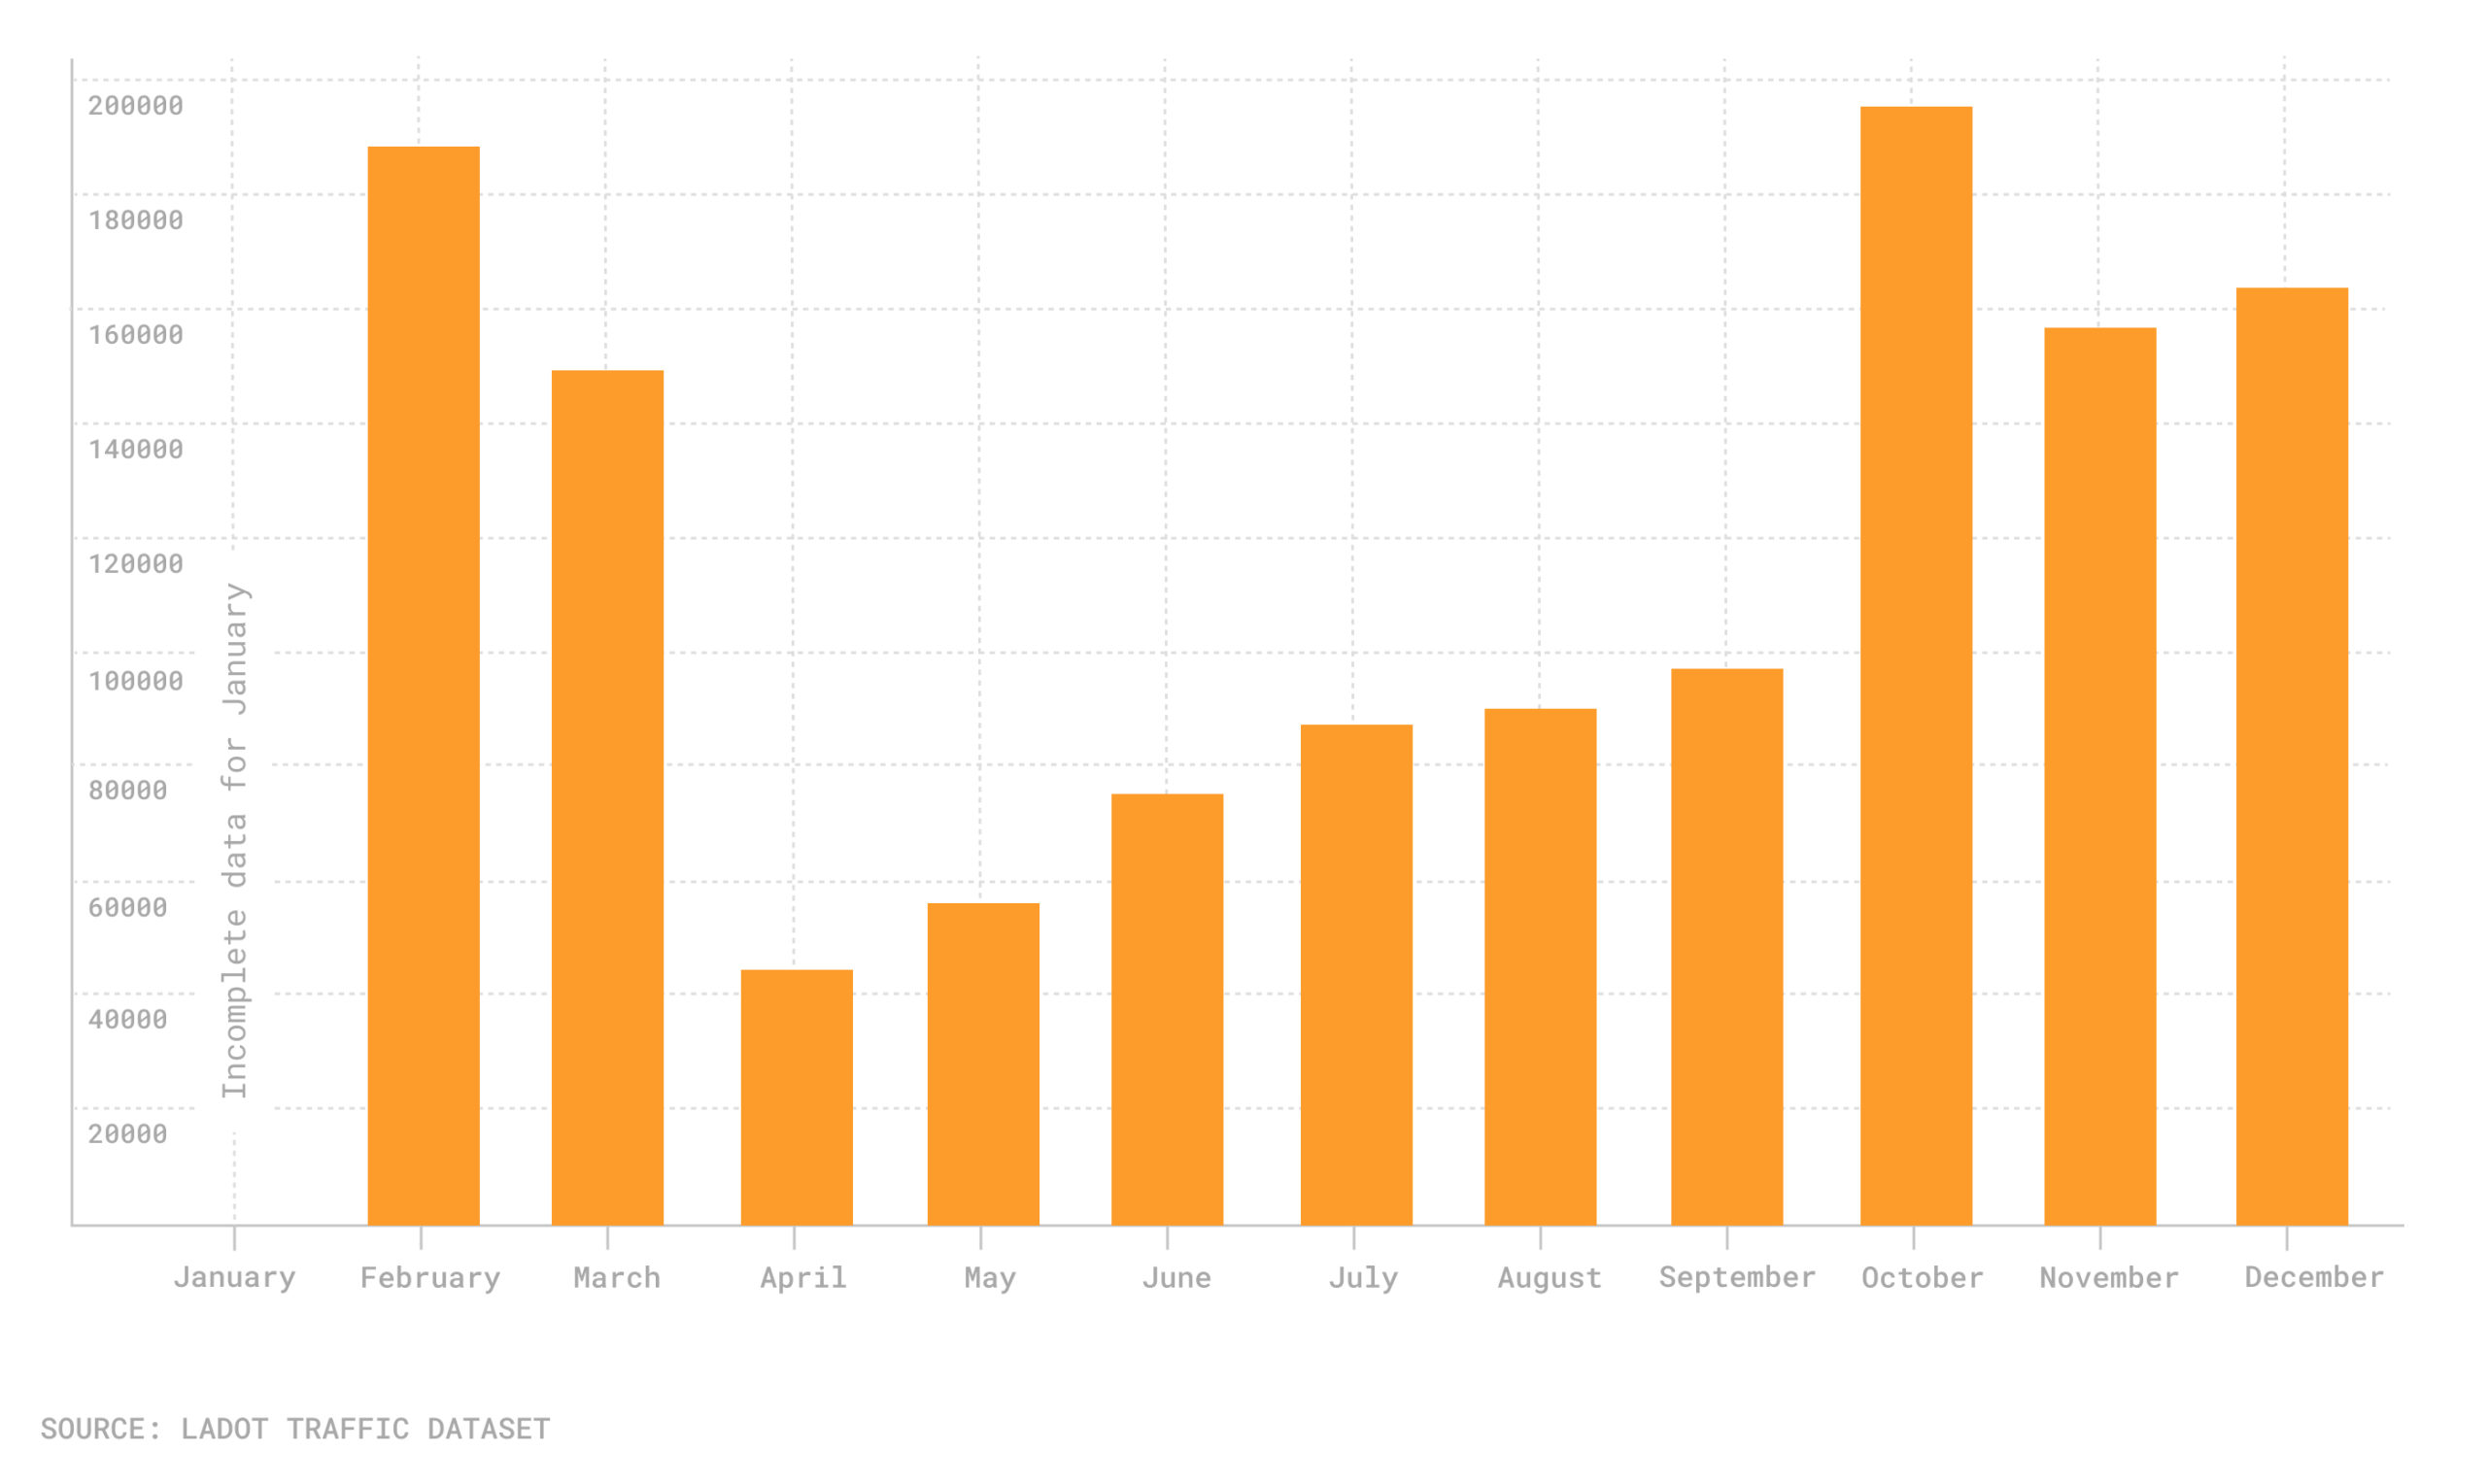
There were nearly 188,000 citations issued in February. The coronavirus lockdown began the next month, and the city moved to relax parking enforcement to make it easier for people staying home to avoid getting a ticket. In April, just 44,040 tickets were handed out.
The numbers began creeping up the next month, with the 55,919 tickets issued in March representing a nearly 27% increase from April. In July, 86,969 vehicles were ticketed.
Parking citations issued in Los Angeles in 2020

The relaxed parking enforcement came to an end on Oct. 15, and the pace of ticketing shot up immediately. That month brought 195,084 citations, a nearly 102% increase from September’s 96,661 tickets. The monthly tally remained above 150,000 for the remainder of the year.
Vehicle owners were given 292,323 citations last year for parking during street cleaning days, or 22% of all tickets issued. There were 271,343 tickets for an expired meter, 21% of the total. Red zone violations accounted for nearly 12% of the tickets issued.
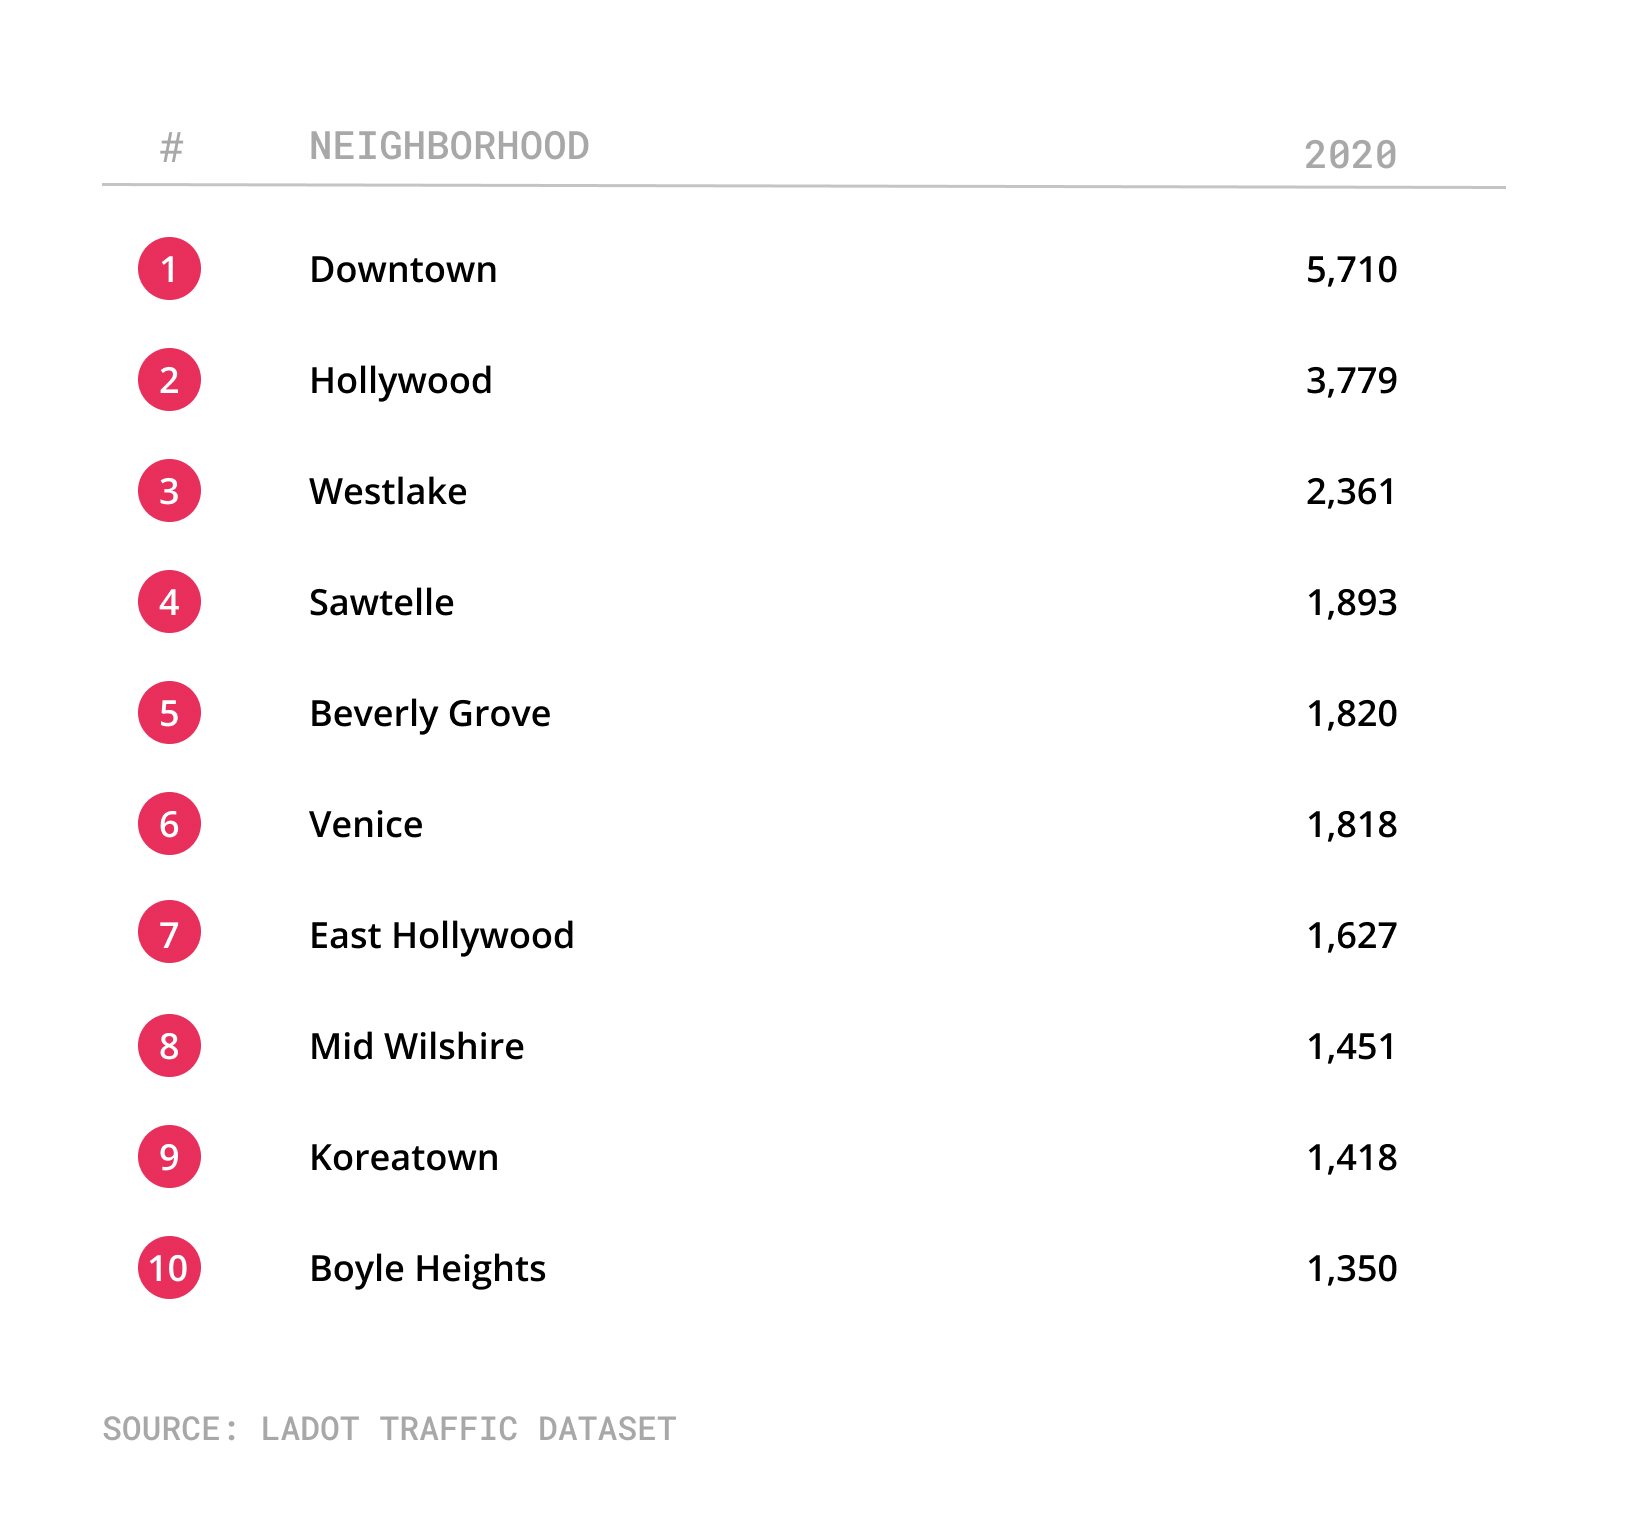
Neighborhoods with the most parking citations in 2020

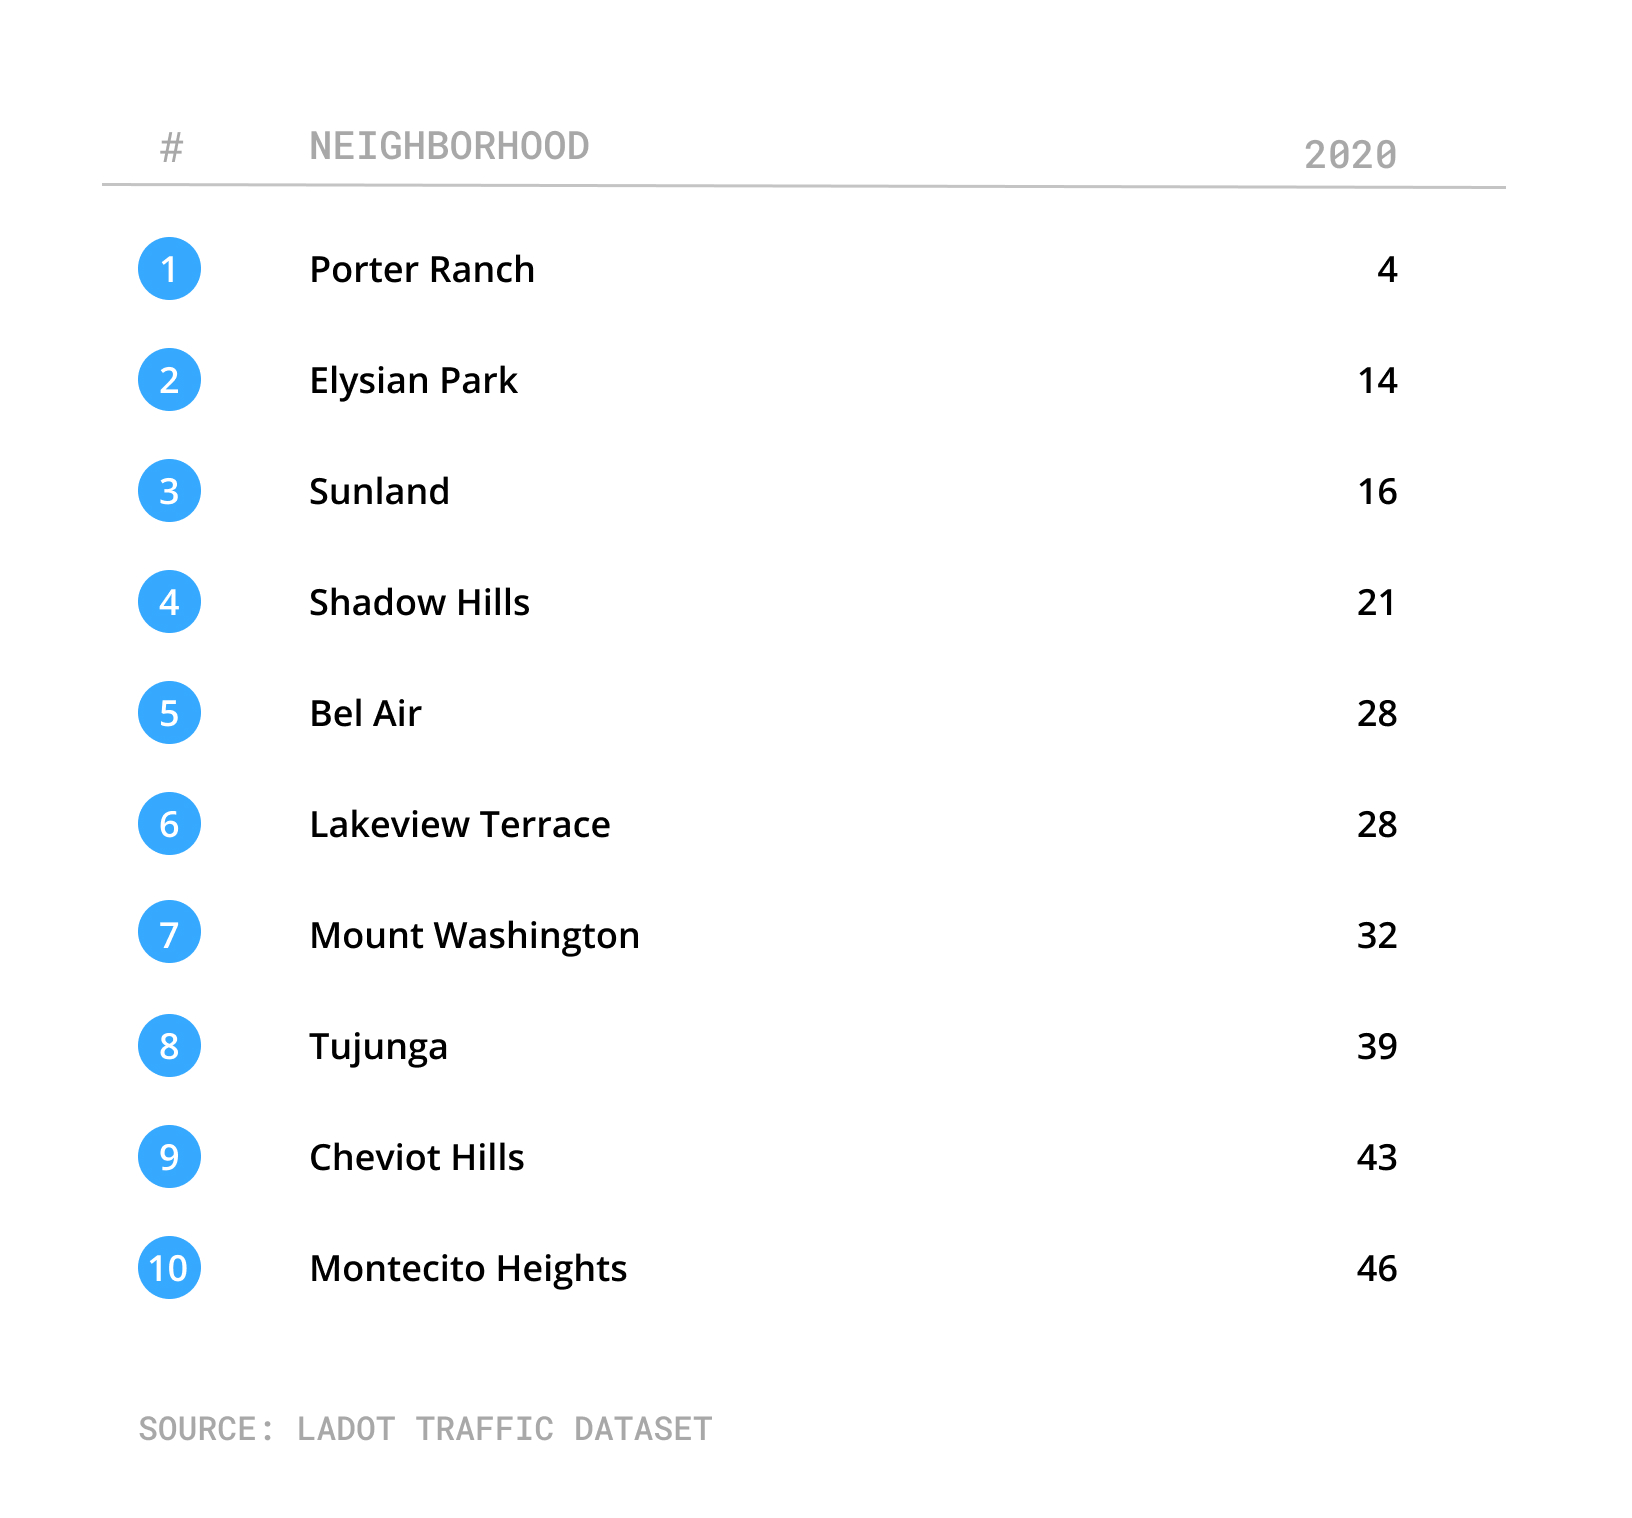
Densely-packed Downtown ranked first in the number of citations issued last year with 5,710, followed by Hollywood, with 3,779. In Porter Ranch, just four tickets were handed out.
Neighborhoods with the fewest parking citations in 2020

The drop in parking tickets may have felt like a holiday for car owners, but it impacted the city’s bottom line, as the money helps pay for things such as street improvements. City Controller Ron Galperin last year projected that city revenue could be nearly $600 million below projections in the current fiscal year (which runs through June 30).
Galperin spokesperson Ian Thompson said parking citation revenue for the previous fiscal year was $114.9 million. He said that revenue for the first six months of this year is “just a hair under $40 million,” though the rise in citations “should result in a second half that is much better than the first half.”
On Nov. 2, the city launched a program encouraging Angelenos to pay parking tickets quickly. Early Pay LA offers a $20 fee reduction for the most common parking citations if they are paid within 48 hours of when the ticket is written. The program is in effect until June 30.
Colin Sweeney, public information director for LADOT, said that as of Jan. 19, a total of 25,841 citations had been paid using Early Pay LA.
Crosstown examined how many parking tickets were issued for 110 neighborhoods in the city of Los Angeles. You can use the search bar to see how your neighborhood compares to others.
Parking citations by neighborhood in 2020
| Neighborhood | Parking citations Jan.-Dec. 2020 |
| Adams-Normandie | 125 |
| Arleta | 99 |
| Arlington Heights | 284 |
| Atwater Village | 269 |
| Baldwin Hills/Crenshaw | 463 |
| Bel-Air | 28 |
| Beverly Crest | 58 |
| Beverly Grove | 1,820 |
| Beverlywood | 49 |
| Boyle Heights | 1,350 |
| Brentwood | 621 |
| Broadway-Manchester | 192 |
| Canoga Park | 369 |
| Carthay | 215 |
| Central Alameda | 135 |
| Century City | 115 |
| Chatsworth | 161 |
| Chesterfield Square | 121 |
| Cheviot Hills | 43 |
| Chinatown | 320 |
| Cypress Park | 109 |
| Del Rey | 175 |
| Downtown | 5,710 |
| Eagle Rock | 287 |
| East Hollywood | 1,627 |
| Echo Park | 799 |
| El Sereno | 217 |
| Elysian Park | 14 |
| Elysian Valley | 73 |
| Encino | 597 |
| Exposition Park | 408 |
| Fairfax | 1297 |
| Florence | 392 |
| Glassell Park | 112 |
| Gramercy Park | 92 |
| Granada Hills | 179 |
| Green Meadows | 142 |
| Hancock Park | 428 |
| Harbor City | 91 |
| Harbor Gateway | 128 |
| Harvard Heights | 239 |
| Harvard Park | 158 |
| Highland Park | 741 |
| Historic South Central | 443 |
| Hollywood | 3,779 |
| Hollywood Hills West | 226 |
| Hyde Park | 326 |
| Jefferson Park | 152 |
| Koreatown | 1,418 |
| Lake Balboa | 60 |
| Lakeview Terrace | 28 |
| Larchmont | 267 |
| Leimert Park | 176 |
| Lincoln Heights | 346 |
| Los Feliz | 687 |
| Manchester Square | 59 |
| Mar Vista | 478 |
| Mid-City | 817 |
| Mid-Wilshire | 1451 |
| Mission Hills | 114 |
| Montecito Heights | 46 |
| Mount Washington | 32 |
| North Hills | 313 |
| North Hollywood | 1,249 |
| Northridge | 414 |
| Pacific Palisades | 499 |
| Pacoima | 375 |
| Palms | 497 |
| Panorama City | 318 |
| Pico-Robertson | 564 |
| Pico-Union | 501 |
| Playa Del Rey | 96 |
| Playa Vista | 81 |
| Porter Ranch | 4 |
| Rancho Park | 62 |
| Reseda | 356 |
| San Pedro | 672 |
| Sawtelle | 1,893 |
| Shadow Hills | 21 |
| Sherman Oaks | 1,281 |
| Silver Lake | 687 |
| South Park | 154 |
| Studio City | 1107 |
| Sun Valley | 401 |
| Sunland | 16 |
| Sylmar | 259 |
| Tarzana | 387 |
| Toluca Lake | 187 |
| Tujunga | 39 |
| University Park | 309 |
| Valley Glen | 371 |
| Valley Village | 262 |
| Van Nuys | 1,276 |
| Venice | 1,818 |
| Vermont Knolls | 340 |
| Vermont Slauson | 361 |
| Vermont Square | 648 |
| Vermont Vista | 274 |
| Watts | 195 |
| West Adams | 219 |
| West Hills | 51 |
| West Los Angeles | 530 |
| Westchester | 531 |
| Westlake | 2,361 |
| Westwood | 1076 |
| Wilmington | 297 |
| Windsor Square | 265 |
| Winnetka | 220 |
| Woodland Hills | 298 |
*An earlier version of this article stated that the Department of Transportation’s collection of parking data for 2019 was incomplete. However, the department had recently updated the missing data on its publicly available database. Crosstown has amended this article accordingly.
How we did it: We examined data from the Los Angeles Department of Transportation from Jan. 1-Dec. 31, 2020.
Interested in our data or have additional questions? Email us at askus@xtown.la.


