

LA burglaries hit lowest level in over a decade


The number of burglaries in Los Angeles hit its lowest level in at least a decade last year, as the protracted COVID-19 shutdown kept people at home.
There were a total of 13,496 reports of home invasions, or breaking into an office or store, in 2020. That’s about 1% less than a year earlier. It’s also the lowest annual number recorded since the Los Angeles Police Department began making its data public in 2010. But the decrease falls short of the overall 11% drop in crime in the city last year.
“We’re seeing fewer residential burglaries because people were stuck at home,” said Kari Garcia, a board member of the Community-Police Advisory Board with the LAPD’s Wilshire Division.
Burglary reports in Los Angeles, 2010-2020

The drop was not felt uniformly across Los Angeles: 43 of the 110 neighborhoods in the city experienced an increase in burglaries last year. In Chinatown, for example, burglary reports shot up to 63 in 2020 from 29 a year earlier. Mission Hills had 93 burglaries, an increase of 107% from 2019.
The Burglaries of Bel-Air
Some of the city’s wealthiest areas also bucked the trend, registering sizable increases. Hancock Park, which often has one of the highest burglary rates in the city, had 44% more burglaries last year than it did in 2019. In Bel-Air, the number of burglaries jumped 45%.
[See the list below to find out how your neighborhood fared.]
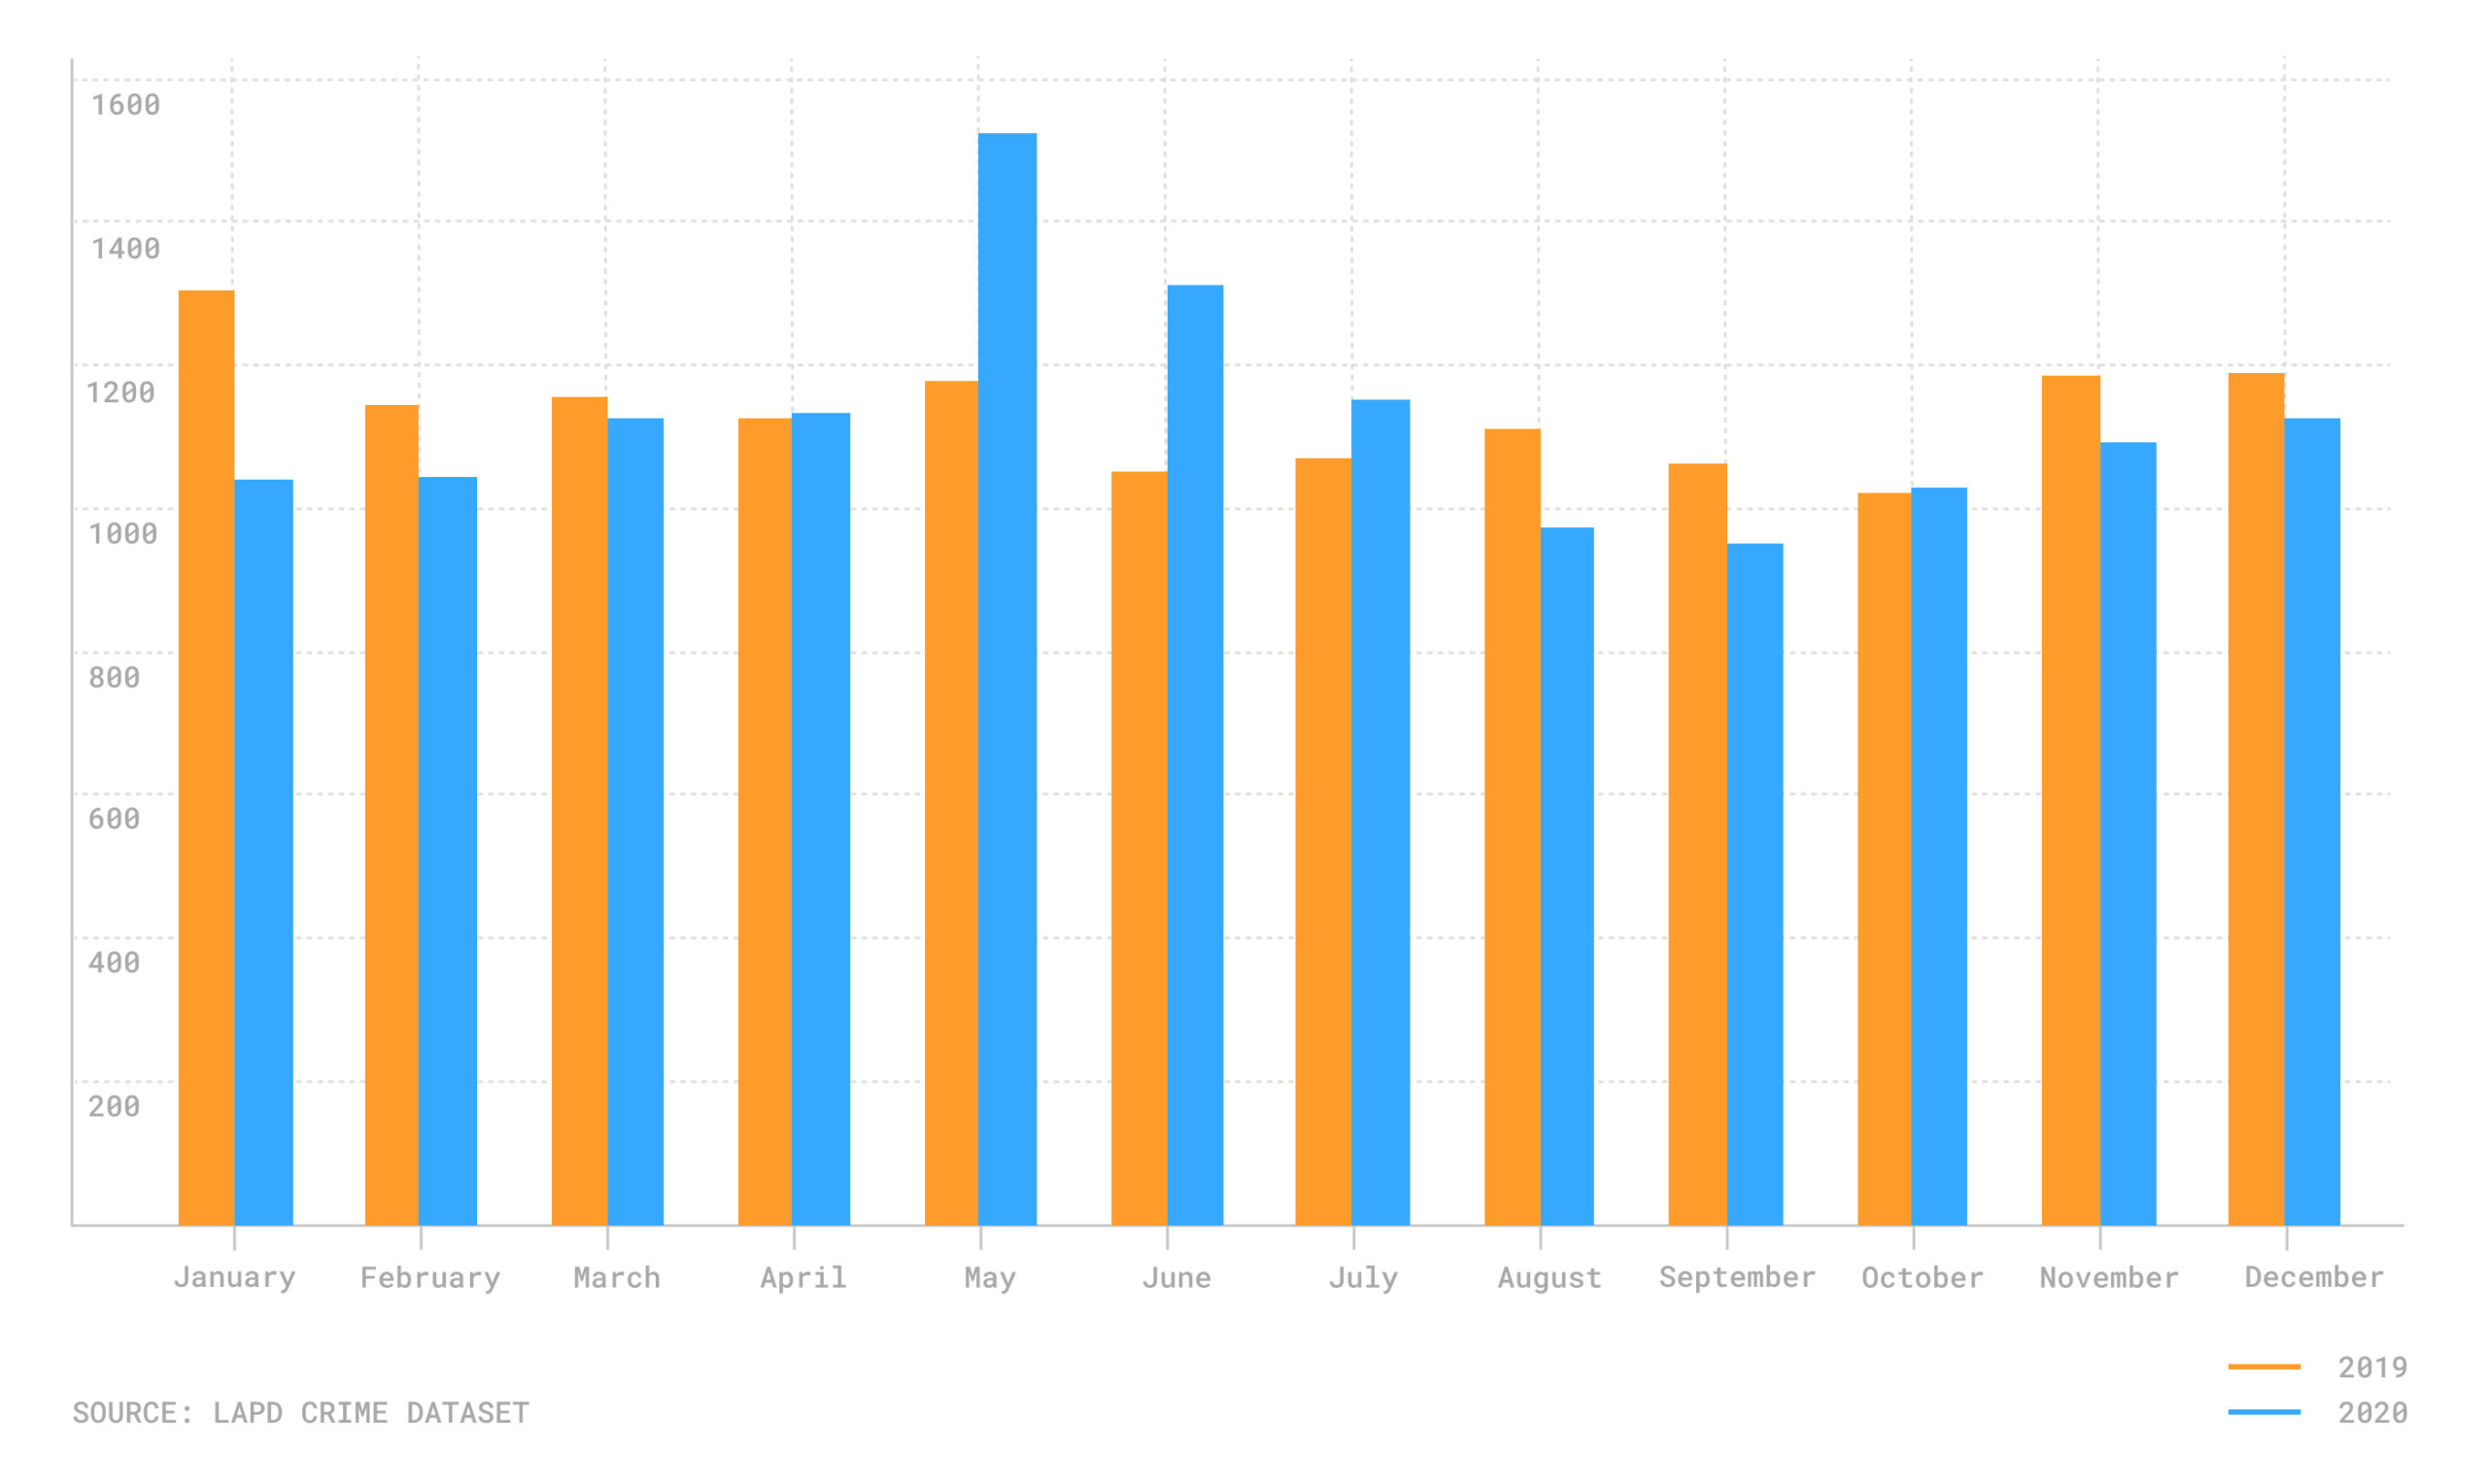
The days of social unrest in May following the police killing of George Floyd in Minneapolis also impacted the numbers. In the wake of the protests, episodes of looting took place Downtown, along stretches of Melrose Avenue and elsewhere. In the neighborhoods of Fairfax and Beverly Grove, during the last two days in May, there were 117 reports of burglaries, almost all of them at businesses. In the entire month of June there were only 22 burglary reports in those neighborhoods.
The looting pushed up the burglary rate (the number of burglaries per 100,000 residents) of all those neighborhoods. Downtown had the most reports, with a burglary rate of 1,471. (The vast majority of the burglaries in Downtown were at businesses, not residences.) Fairfax was second, at 1,268, while Beverly Grove had the third highest rate, at 1,203.
Los Angeles burglaries by month, 2019 vs. 2020
Arleta recorded the lowest burglary rate in the city, at 86 per 100,000 residents.
A residential burglary can cause severe trauma for victims, according to several studies. However, in Los Angeles, the number of burglaries has fallen in 10 of the past 11 years. In 2020, there were 22% fewer break-ins than in 2010.
Use the chart below to locate the number of burglaries and burglary rate for every neighborhood in the city of Los Angeles.
| Neighborhood | 2019 burglaries | 2019 burglary rate | 2020 burglaries | 2020 burglary rate | Percent change |
| Mount Washington | 57 | 401.3802 | 17 | 119.7099 | -70.18% |
| Beverlywood | 44 | 607.3992 | 14 | 193.2634 | -68.18% |
| Shadow Hills | 71 | 546.1959 | 28 | 215.4012 | -60.56% |
| Elysian Valley | 48 | 648.2982 | 23 | 310.6429 | -52.08% |
| Manchester Square | 69 | 599.1664 | 36 | 312.6085 | -47.83% |
| Elysian Park | 9 | 377.2003 | 5 | 209.5557 | -44.44% |
| Glassell Park | 82 | 340.475 | 46 | 190.9982 | -43.90% |
| Porter Ranch | 90 | 345.6221 | 51 | 195.8525 | -43.33% |
| Arleta | 50 | 148.0166 | 29 | 85.84962 | -42.00% |
| Hyde Park | 146 | 411.7199 | 86 | 242.52 | -41.10% |
| Watts | 138 | 307.0829 | 82 | 182.4696 | -40.58% |
| Jefferson Park | 64 | 252.5751 | 39 | 153.9129 | -39.06% |
| Beverly Crest | 49 | 434.937 | 30 | 266.2879 | -38.78% |
| Lincoln Heights | 75 | 261.7892 | 46 | 160.5641 | -38.67% |
| Chesterfield Square | 38 | 460.7736 | 24 | 291.0149 | -36.84% |
| Vermont Vista | 120 | 499.355 | 76 | 316.2582 | -36.67% |
| Tarzana | 257 | 680.9931 | 169 | 447.8126 | -34.24% |
| Granada Hills | 193 | 362.1285 | 127 | 238.2918 | -34.20% |
| Rancho Park | 41 | 741.2764 | 27 | 488.1577 | -34.15% |
| Mid City | 279 | 536.9308 | 191 | 367.5763 | -31.54% |
| Encino | 303 | 662.8456 | 211 | 461.5856 | -30.36% |
| West Adams | 95 | 445.4239 | 68 | 318.8297 | -28.42% |
| Gramercy Park | 50 | 468.7793 | 36 | 337.5211 | -28.00% |
| Florence | 178 | 338.1523 | 130 | 246.9652 | -26.97% |
| Mar Vista | 170 | 449.3432 | 125 | 330.3994 | -26.47% |
| University Park | 95 | 393.0492 | 70 | 289.6152 | -26.32% |
| Panorama City | 127 | 180.8808 | 96 | 136.7288 | -24.41% |
| Woodland Hills | 417 | 621.0995 | 317 | 472.1548 | -23.98% |
| West Hills | 109 | 277.3607 | 83 | 211.2013 | -23.85% |
| Broadway Manchester | 122 | 431.4003 | 93 | 328.8543 | -23.77% |
| Vermont Square | 131 | 265.2627 | 100 | 202.4906 | -23.66% |
| Sun Valley | 268 | 373.5556 | 205 | 285.7422 | -23.51% |
| Vermont Slauson | 94 | 350.2757 | 73 | 272.0227 | -22.34% |
| Eagle Rock | 96 | 280.4312 | 75 | 219.0868 | -21.88% |
| Studio City | 274 | 687.5612 | 218 | 547.0377 | -20.44% |
| Vermont Knolls | 93 | 429.8789 | 75 | 346.6765 | -19.36% |
| Westchester | 207 | 502.5126 | 167 | 405.4087 | -19.32% |
| Windsor Square | 58 | 866.4476 | 47 | 702.1213 | -18.97% |
| Harbor City | 91 | 352.2626 | 74 | 286.4553 | -18.68% |
| South Park | 86 | 257.9561 | 70 | 209.9643 | -18.61% |
| Adams-Normandie | 35 | 195.258 | 29 | 161.7852 | -17.14% |
| North Hollywood | 310 | 378.7462 | 259 | 316.4364 | -16.45% |
| Hollywood Hills | 123 | 577.5733 | 105 | 493.0503 | -14.63% |
| Cheviot Hills | 53 | 605.922 | 46 | 525.8946 | -13.21% |
| Sherman Oaks | 297 | 414.9494 | 263 | 367.4467 | -11.45% |
| Toluca Lake | 63 | 685.3786 | 56 | 609.2254 | -11.11% |
| Lake Balboa | 76 | 280.2877 | 68 | 250.7837 | -10.53% |
| North Hills | 102 | 163.4249 | 92 | 147.4028 | -9.80% |
| Carthay | 31 | 578.7901 | 28 | 522.7782 | -9.68% |
| Montecito Heights | 32 | 180.5462 | 29 | 163.62 | -9.38% |
| Exposition Park | 87 | 246.9136 | 79 | 224.2089 | -9.20% |
| Chatsworth | 200 | 396.55 | 182 | 360.8605 | -9.00% |
| Silver Lake | 157 | 503.3826 | 145 | 464.9075 | -7.64% |
| Green Meadows | 109 | 312.787 | 101 | 289.8301 | -7.34% |
| Hollywood Hills West | 84 | 526.151 | 78 | 488.5687 | -7.14% |
| Sylmar | 140 | 174.2876 | 130 | 161.8385 | -7.14% |
| Harvard Park | 46 | 488.1673 | 43 | 456.3303 | -6.52% |
| Valley Village | 94 | 365.1053 | 88 | 341.8007 | -6.38% |
| Brentwood | 152 | 462.4981 | 144 | 438.1561 | -5.26% |
| Sawtelle | 276 | 653.6722 | 264 | 625.2516 | -4.35% |
| Valley Glen | 170 | 290.6231 | 164 | 280.3658 | -3.53% |
| Westlake | 268 | 248.7008 | 260 | 241.2769 | -2.99% |
| Los Feliz | 138 | 412.0387 | 134 | 400.0955 | -2.90% |
| San Pedro | 223 | 276.6715 | 219 | 271.7088 | -1.79% |
| Echo Park | 118 | 337.6252 | 118 | 337.6252 | 0.00% |
| Lakeview Terrace | 28 | 206.2008 | 28 | 206.2008 | 0.00% |
| Leimert Park | 51 | 405.8571 | 51 | 405.8571 | 0.00% |
| Playa Del Rey | 42 | 367.3255 | 42 | 367.3255 | 0.00% |
| Winnetka | 141 | 261.6198 | 142 | 263.4753 | 0.71% |
| Del Rey | 102 | 339.8867 | 103 | 343.2189 | 0.98% |
| El Sereno | 76 | 180.6212 | 77 | 182.9978 | 1.32% |
| Pico Robertson | 92 | 502.54 | 94 | 513.4648 | 2.17% |
| Mid-Wilshire | 190 | 445.1525 | 201 | 470.9245 | 5.79% |
| Reseda | 162 | 226.355 | 172 | 240.3275 | 6.17% |
| Baldwin Hills-Crenshaw | 110 | 370.7199 | 119 | 401.0515 | 8.18% |
| Pacific Palisades | 67 | 268.1072 | 73 | 292.1168 | 8.96% |
| Venice | 287 | 842.9276 | 313 | 919.2904 | 9.06% |
| Wilmington | 193 | 331.8375 | 211 | 362.7861 | 9.33% |
| Westwood | 129 | 243.1668 | 142 | 267.672 | 10.08% |
| Highland Park | 76 | 143.3611 | 84 | 158.4517 | 10.53% |
| Harbor Gateway | 165 | 399.4384 | 183 | 443.0135 | 10.91% |
| Van Nuys | 276 | 247.2343 | 311 | 278.5865 | 12.68% |
| Boyle Heights | 241 | 261.8541 | 272 | 295.5365 | 12.86% |
| Northridge | 201 | 297.5353 | 231 | 341.9436 | 14.93% |
| Larchmont | 38 | 442.1175 | 45 | 523.5602 | 18.42% |
| East Hollywood | 143 | 208.75 | 173 | 252.5437 | 20.98% |
| Pacoima | 114 | 148.5807 | 142 | 185.0742 | 24.56% |
| Canoga Park | 182 | 305.1592 | 227 | 380.6107 | 24.73% |
| Century City | 40 | 647.7733 | 50 | 809.7166 | 25.00% |
| Pico Union | 105 | 248.8918 | 133 | 315.263 | 26.67% |
| Palms | 112 | 262.0128 | 146 | 341.5524 | 30.36% |
| Playa Vista | 64 | 575.2292 | 84 | 754.9883 | 31.25% |
| West Los Angeles | 100 | 775.9156 | 142 | 1101.8 | 42.00% |
| Hancock Park | 68 | 631.1491 | 98 | 909.5972 | 44.12% |
| Bel-Air | 29 | 380.8273 | 42 | 551.543 | 44.83% |
| Koreatown | 244 | 227.3659 | 359 | 334.5261 | 47.13% |
| Tujunga | 60 | 219.555 | 89 | 325.6733 | 48.33% |
| Atwater Village | 29 | 258.7899 | 44 | 392.6468 | 51.72% |
| Beverly Grove | 174 | 790.0831 | 265 | 1203.287 | 52.30% |
| Cypress Park | 18 | 183.9362 | 28 | 286.123 | 55.56% |
| Historic South Central | 144 | 295.6879 | 228 | 468.1725 | 58.33% |
| Hollywood | 294 | 402.0843 | 467 | 638.6849 | 58.84% |
| Sunland | 31 | 212.1254 | 52 | 355.8232 | 67.74% |
| Downtown | 431 | 860.5371 | 737 | 1471.498 | 71.00% |
| Fairfax | 98 | 726.7873 | 171 | 1268.17 | 74.49% |
| Arlington Heights | 50 | 210.3669 | 95 | 399.6971 | 90.00% |
| Central Alameda | 50 | 115.9313 | 99 | 229.5439 | 98.00% |
| Harvard Heights | 39 | 200.0308 | 79 | 405.1905 | 102.56% |
| Mission Hills | 45 | 240.0384 | 94 | 501.4136 | 108.89% |
| Chinatown | 29 | 211.8799 | 63 | 460.2908 | 117.24% |
How we did it: We looked at LAPD publicly available data on reported burglaries and attempted burglaries from 2010 through 2020. For neighborhood boundaries, we rely on the borders defined by the Los Angeles Times. Learn more about our data here.
LAPD data only reflects crimes that are reported to the department, not how many crimes actually occurred. In making our calculations, we rely on the data that the LAPD makes publicly available. On occasion, LAPD may update past crime reports with new information, or recategorize past reports. Those revised reports do not always automatically become part of the public database.
Want to know how your neighborhood fares? Or simply just interested in our data? Email us at askus@xtown.la.


