

The Crosstown COVID tracker


The coronavirus has been an inescapable part of life for nearly a year. While the risks of spread remain high in Los Angeles County, the situation is constantly changing, and Crosstown is following the shifts. Here is our weekly rundown of the most important local data.
![]()
Cases and deaths
Cases have continued their downward trajectory, and on Tuesday, Feb. 2, the Los Angeles County Department of Public Health reported 3,763 new COVID-19 cases. This is the first time the daily total has dipped below 4,000 since Nov. 28, and the level is down from the middle of last month, when daily totals sometimes surpassed 14,000. As the number of new cases decreases, the seven-day average has dropped as well; the average of 5,921 daily cases from Jan. 26–Feb. 2 marks a 25.5% decrease from the daily average of 7,947 cases the week before (the seven-day average tracks the broader trend of new virus cases, which, on a single day, can swing dramatically).
Despite the fall in new cases, deaths remain high. Saturday, Jan. 30, saw 316 deaths, just below the record of 318 deaths on Jan. 8. The seven-day daily average for COVID-19 deaths from Jan. 26-Feb. 2 was 211, nearly identical to the 212 the week before. Deaths are a lagging indicator, so it will likely be a few weeks before numbers fall.
COVID-19 hospitalizations in Los Angeles, November to Feb. 4
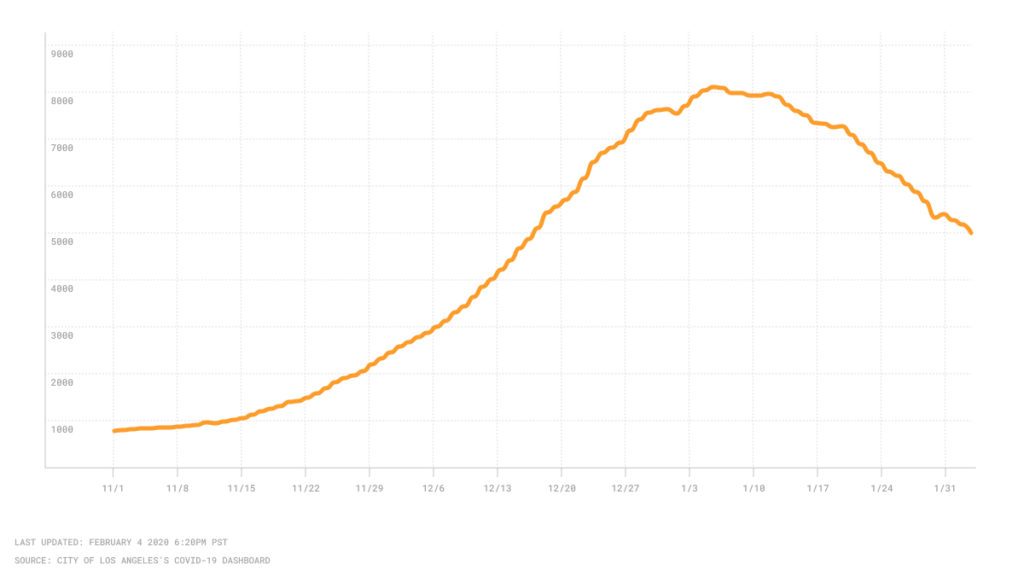
Hospitalizations
While hospitalizations are often a lagging indicator as well, this figure has been steadily declining since the middle of last month. On Feb. 2, the county reported a three-day average of 5,259 hospitalizations, a 16.6% decrease from the 6,307 reported on Jan. 26. The peak of 8,098 hospitalizations was recorded almost a month ago, on Jan. 7. As of Feb. 2, 27% of those hospitalized were being treated in the ICU.
Coronavirus doses sent to Los Angeles each week, Dec. 14-Jan. 25

Vaccinations
The first local coronavirus vaccines were administered on Dec. 14. The cumulative number of vaccine doses received by Los Angeles County was about 1,000,000 as of Jan. 25. According to the County Department of Public Health, by Jan. 29, 790,902 doses had gone into arms, though it is unclear exactly how many are first or second doses. Last week, Los Angeles County received about 146,000 coronavirus vaccine doses. This marks a decline from the 168,000 doses received the week before, according to county data.
No Super Spreader
Millions of Angelenos will watch the Chiefs-Buccaneers battle this Sunday, but health and elected officials are begging the public not to do so in large groups. “Stay home on Super Bowl Sunday,” urged Public Health Director Dr. Barbara Ferrer on Feb. 1. “The last thing we need right now are super-spreader events that set us back and potentially could lead to more cases, serious illness and tragic deaths.”
How We Did It: We analyzed coronavirus data related to new cases, deaths, hospitalizations and vaccinations data provided by the Los Angeles County Department of Public Health.
Interested in our data? Check out the Crosstown coronavirus interactive map or email us at askus@xtown.la.


