

The Crosstown COVID tracker


Crosstown tracks the most important local data on how Los Angeles is faring with COVID-19. Here is our weekly rundown of the essential stats you need to know.
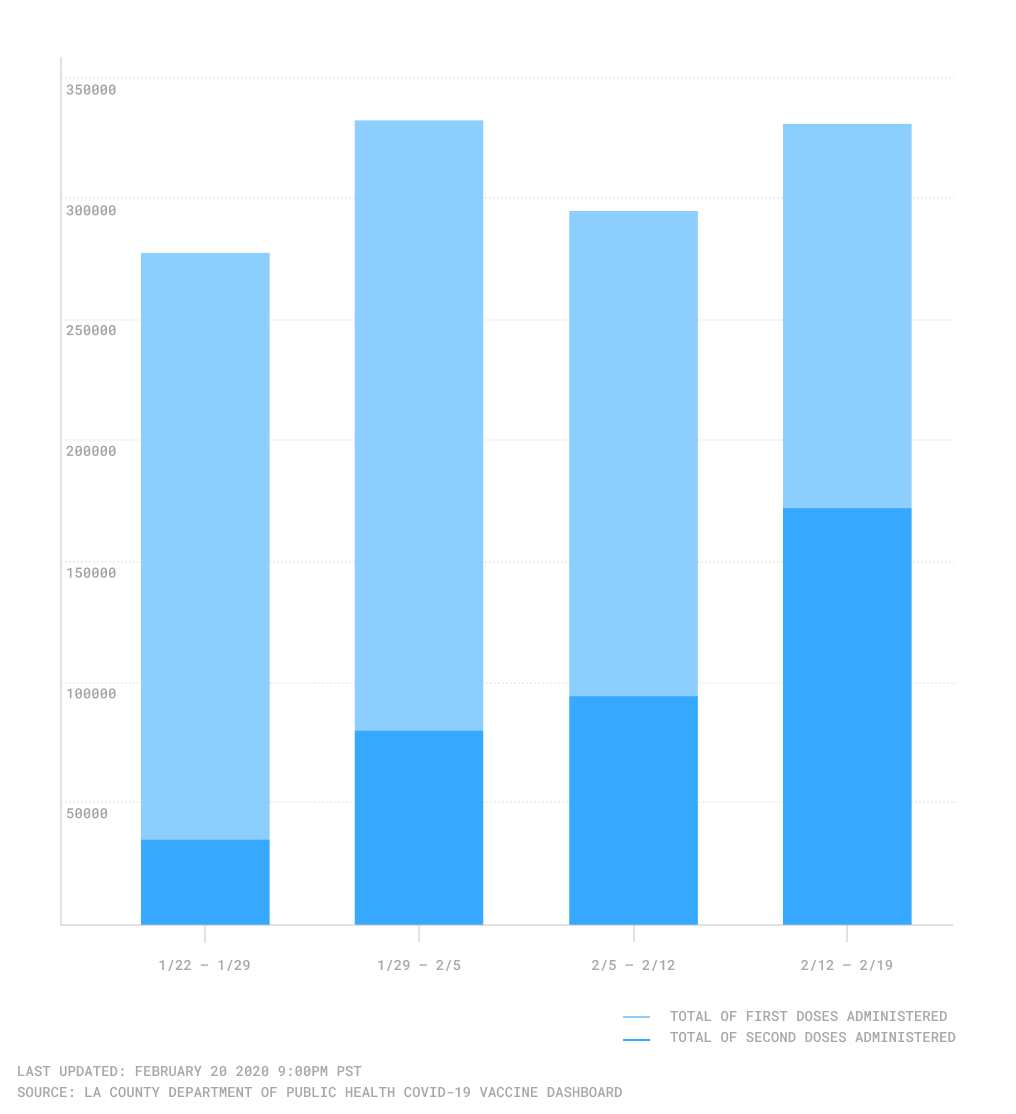
Vaccine doses administered in Los Angeles County by week
Vaccinations
Last week, the county administered 330,951 doses. That marks a 12% increase from the previous week.
As of Feb. 19, Los Angeles County had administered a total of 1,676,900 coronavirus vaccine doses. Most notably, 471,162, or 28%, of these inoculations are second doses.
While the county has been making progress, inclement weather in the East and South have disrupted the supply chain of vaccines, and may slow the arrival of more doses. For the week of Feb. 15, Los Angeles County received 262,925 new coronavirus vaccine doses; this marks a 47.6% increase from the 137,725 doses delivered the week of Jan. 25.
Even as the number of weekly doses arriving in the county increases, facilities are going through vaccinations more quickly. As of Feb. 19, the county had administered 91.6% of its available vaccines – compared with just 55.1% four weeks prior. This means that if deliveries are disrupted, distribution sites could run out of doses more quickly.
Cases and Deaths
![]()
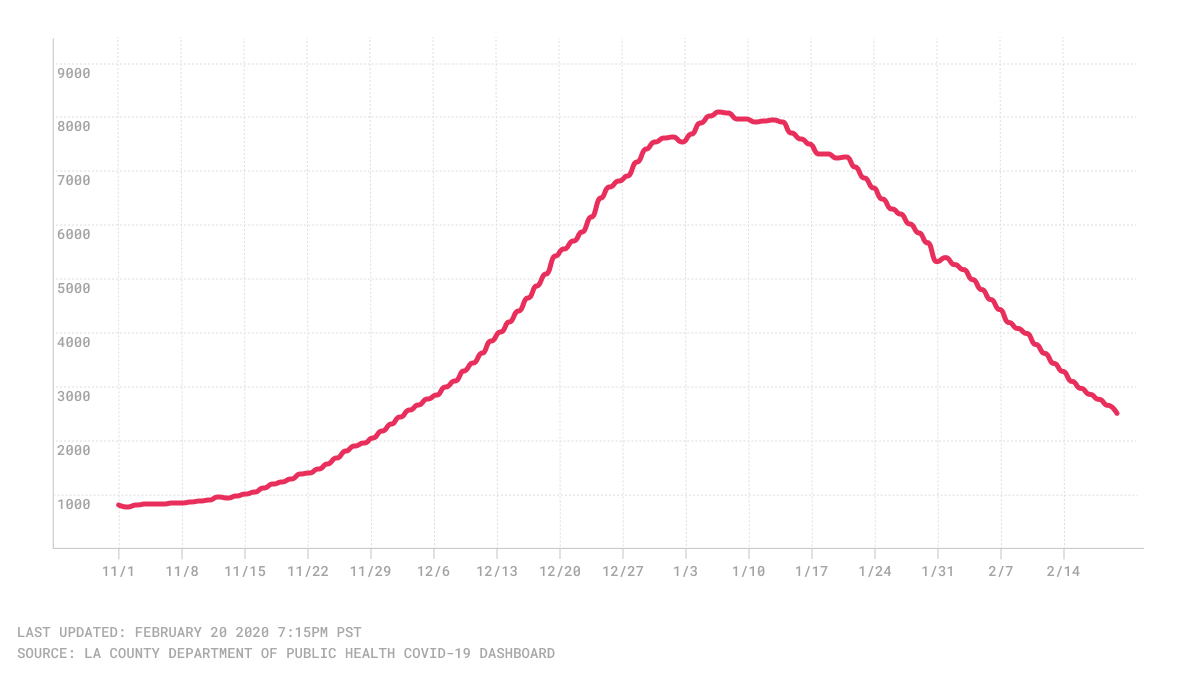
New COVID-19 infections are decreasing steadily across Los Angeles County. On Friday, Feb. 19, the Los Angeles County Department of Public Health reported 2,459 new cases, a 73.5% decrease from the 9,277 daily cases reported four weeks prior, on Jan 22. The seven-day-average is on a similar trajectory; Feb. 19 saw a daily average of 2,292 COVID-19 cases. This is a 76.5% decrease from the four weeks prior as well, when the seven-day average was 9,735 cases.
Seven-day average of new COVID-19 infections
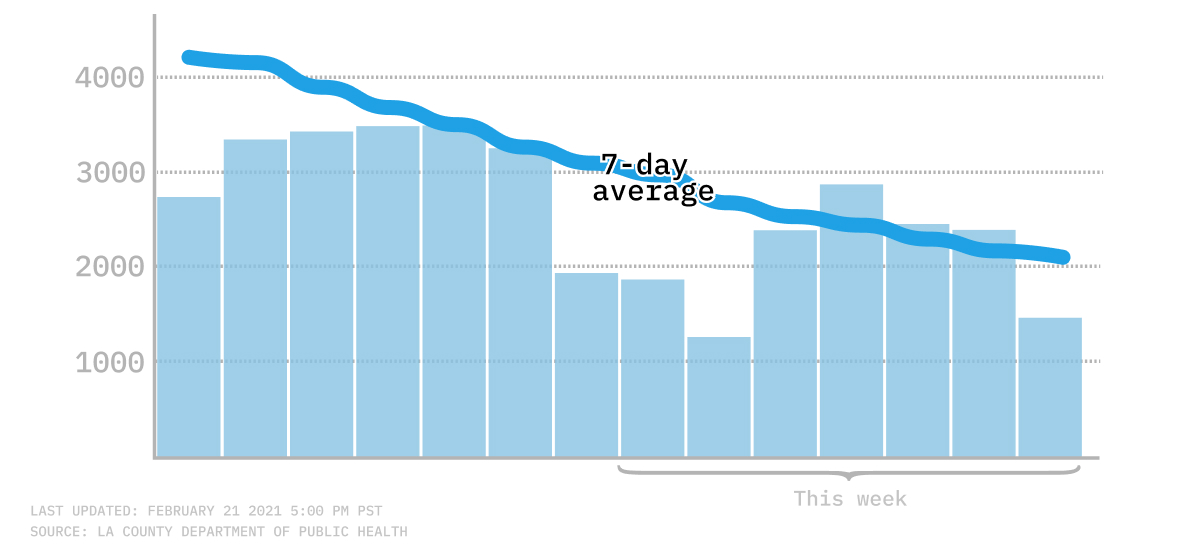
While the daily COVID-19 death figures continue to fluctuate, the seven-day average is starting to see some downward movement. On Sunday, the seven-day average number of deaths attributed to COVID-19 was 120. Just two weeks prior, the average sat at 148, marking a 19% decrease. However, just three months earlier, on Nov. 19, the average number of daily deaths was 19.
Three-day average of countywide COVID-19 hospitalizations
Hospitalizations
Hospitalizations also have declined in recent weeks. On Feb. 19, the County Department of Public Health confirmed a three-day average of 2,640 hospitalizations. This is a major improvement from the 8,000+ hospitalizations reported at the beginning of January, but still much higher than the 800+ hospitalizations in the early days of November.
Hospitalizations are a lagging indicator; as cases continue to decrease, we can expect reduced hospitalizations in the coming weeks following the initial infections. While there is still a long way to go before we reach pre-winter surge levels, Feb. 16 was the first day to report fewer than 3,000 hospitalizations, and recent days have been showing a similar trend.
How We Did It: We analyzed coronavirus data related to new cases, deaths, hospitalization and vaccinations data provided by the Los Angeles County Department of Public Health.
Interested in our data? Check out the Crosstown coronavirus interactive map or email us at askus@xtown.la.


