

The Crosstown COVID Tracker


The impact of COVID-19 on Los Angeles is changing rapidly. To help you keep up, here is our weekly rundown of the most important local data on vaccinations, new cases and testing.
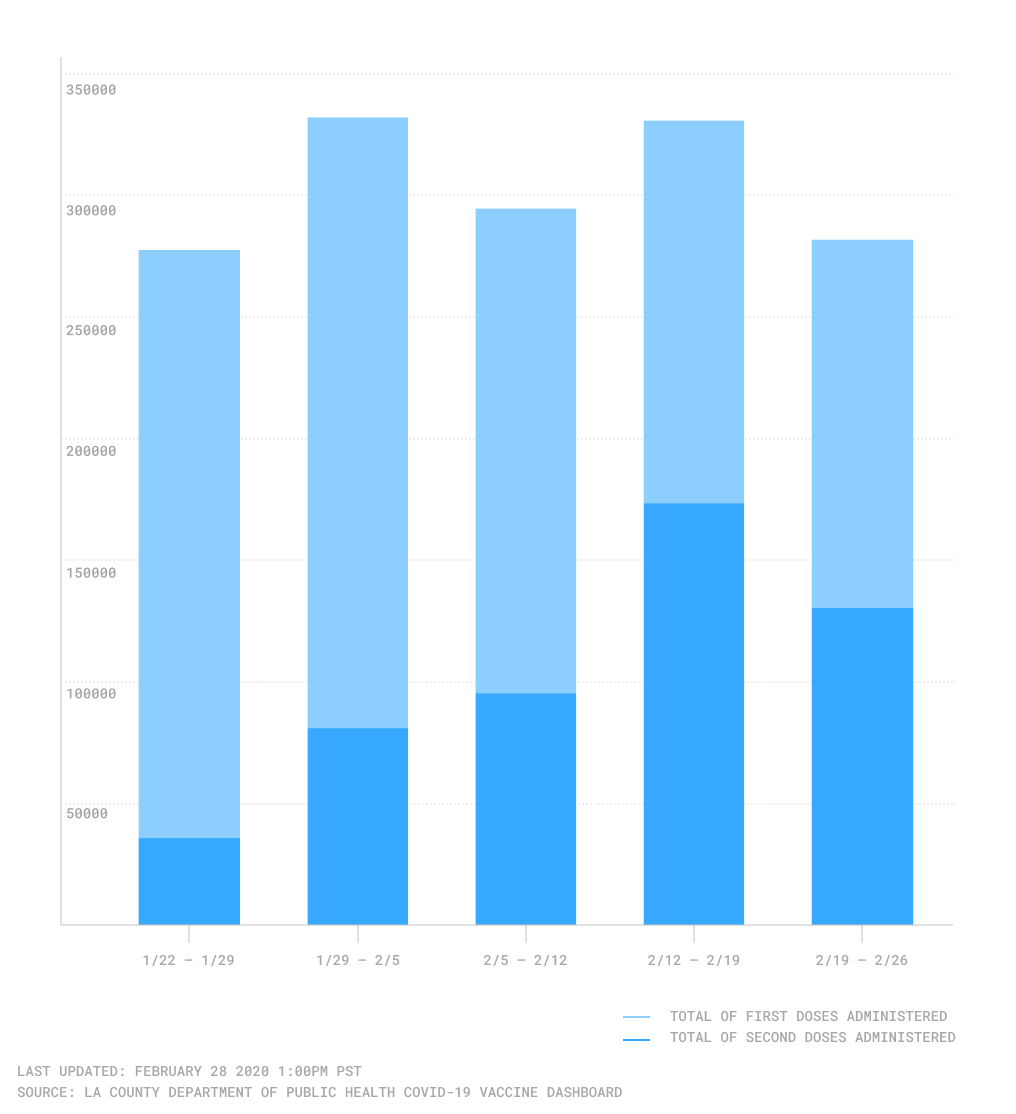
Vaccine doses administered in Los Angeles County by week
Vaccinations
Nearly 2 million doses of the coronavirus vaccine have been administered in Los Angeles County. As of Friday, Feb. 26, the county reported that it has administered 1,958,547 vaccinations, with 600,497 of those being second doses. This is nearly double the number of vaccinations that had been administered at the beginning of February. Just three weeks prior, on Feb. 5, Los Angeles hit the milestone of administering over 1 million vaccinations with a total of 1,051,229.
While this is steady progress, Los Angeles County is still facing issues with scarce supply. In the Feb. 22 Public Health press release, the county stated that it had the capacity for 500,000 appointment slots for the week, yet there were only enough doses for 209,000 appointments. Limited vaccine availability will likely remain an issue as long as inclement weather continues to affect the supply chain. However, there is some good news.
On Friday, Feb. 26, the FDA advisory committee voted to support Johnson & Johnson’s one-dose coronavirus vaccine for emergency use authorization, making it the third vaccine available for public use throughout the United States. It’s expected that four million doses of the new vaccine will roll out this week nationwide, and 20 million will have gone into arms by the end of March.
Cases and Deaths
![]()
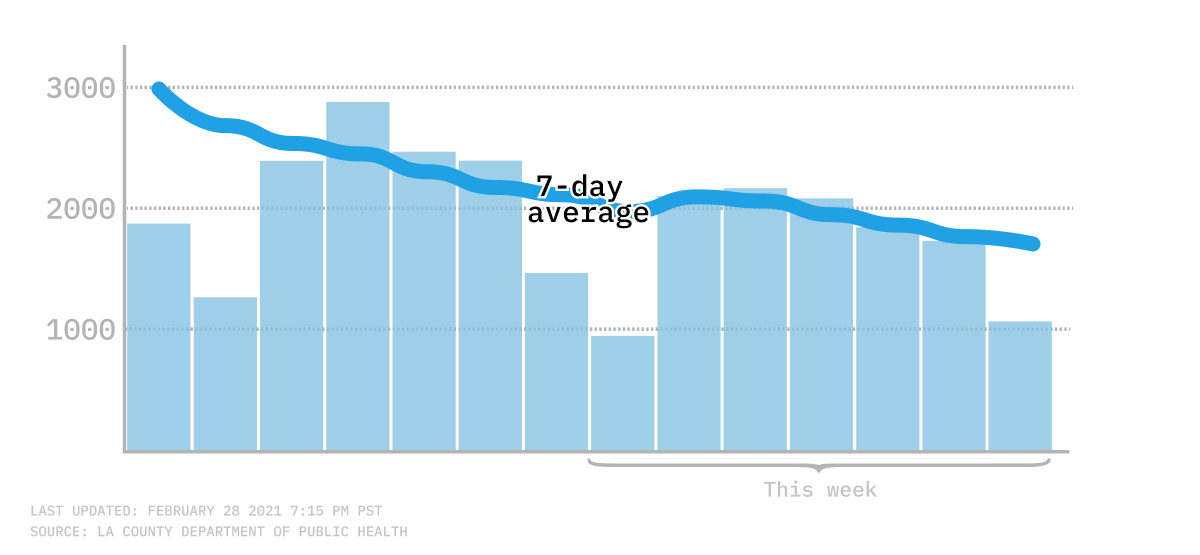
For the past few weeks, COVID-19 cases have been decreasing throughout the county at a steady clip. On Friday, Feb. 26, the Los Angeles County Department of Public Health reported 1,838 new COVID-19 cases. This marks a 47.4% decrease from the 3,497 cases reported two weeks prior. In comparison, Feb. 19 saw 2,459 new cases, a 48.4% decrease from the two weeks prior, as well. This trend is consistent with the seven-day average for cases: From Feb. 12 to Feb. 16, average COVID-19 cases dropped from 3,500 to 1,851, a 47.1% decrease.
Seven-day average of new COVID-19 infections
Meanwhile, reported COVID-19 deaths remain high in Los Angeles County. On Feb. 26, the county reported 144 new deaths, marking a 5.1% increase from two weeks prior, on Feb. 12. While this may seem like a step backwards, the seven-day average shows a more promising trajectory. Over the course of four weeks, average COVID-19 deaths fell from 207 on Jan. 29 to 117 on Feb. 26, a 43.4% decrease.
COVID-19 testing positivity rate
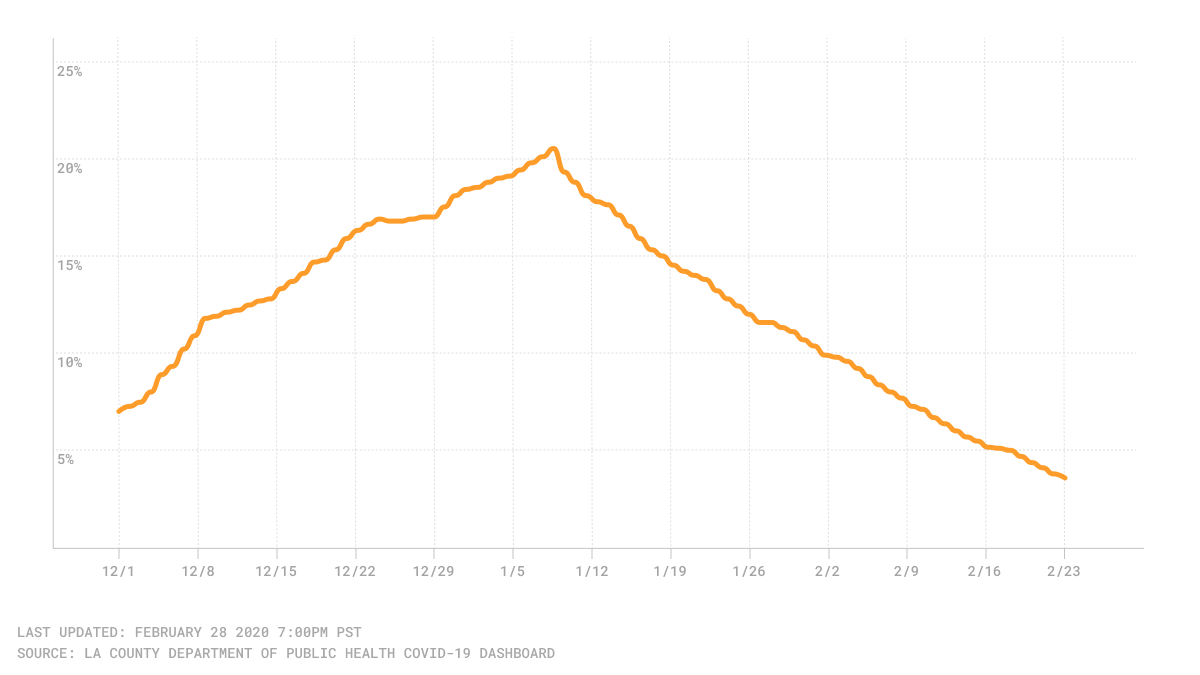
Positivity Rate
Over the past month, Los Angeles County has seen a remarkable drop in the COVID-19 positivity rate. That’s the percentage of all COVID-19 test results that come back positive for the virus. On Friday, Feb. 26, the seven-day average positivity rate for the county was 3.8%, the lowest it’s been since Nov. 6. As recently as Jan. 29, the positivity rate was more than three times higher, at 12%.
How We Did It: We analyzed coronavirus data related to new cases, deaths, hospitalization and vaccinations data provided by the Los Angeles County Department of Public Health.
Interested in our data? Check out the Crosstown coronavirus interactive map or email us at askus@xtown.la.


