

The Crosstown COVID Tracker


The COVID-19 landscape in Los Angeles is changing rapidly. To keep you up to date, here is our weekly rundown of the most important local data on vaccinations, new cases, and hospitalizations.
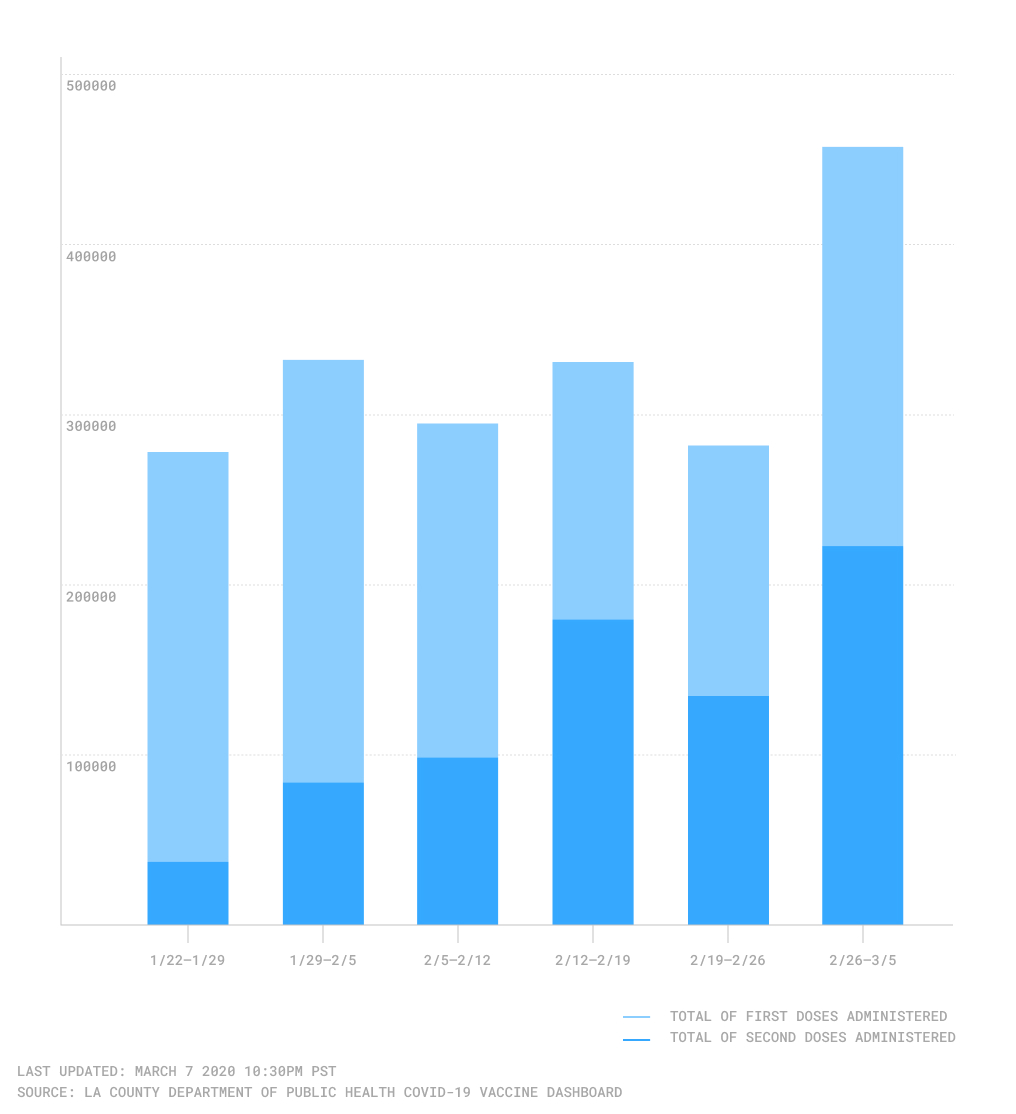
Vaccine doses administered in Los Angeles County by week
Vaccinations
Los Angeles County recently hit the milestone of administering over 2 million doses of the coronavirus vaccine. On Friday, March 5, the Department of Public Health reported that the county has administered 2,415,460 total vaccinations. Of those, 814,593 were second doses.
Last week, the County blew through all previous records. Between Feb. 26–March 5, there were a total of 456,913 vaccinations administered, an increase of 62.2% from the previous week. Of those, 214,096 were second doses, up 65.5% from a week earlier.
While the number of vaccinations is increasing, Los Angeles County is still experiencing supply issues. In the March 5 press release, the Department of Public Health announced that the county now has the capacity for 600,000 appointments, but only enough doses for 280,000. However, this week’s shipment of vaccines is expected to contain 312,000 doses, the largest shipment to date. In addition, this shipment will include 53,700 doses of the new Johnson & Johnson vaccine, which only requires one dose.
Cases and Deaths
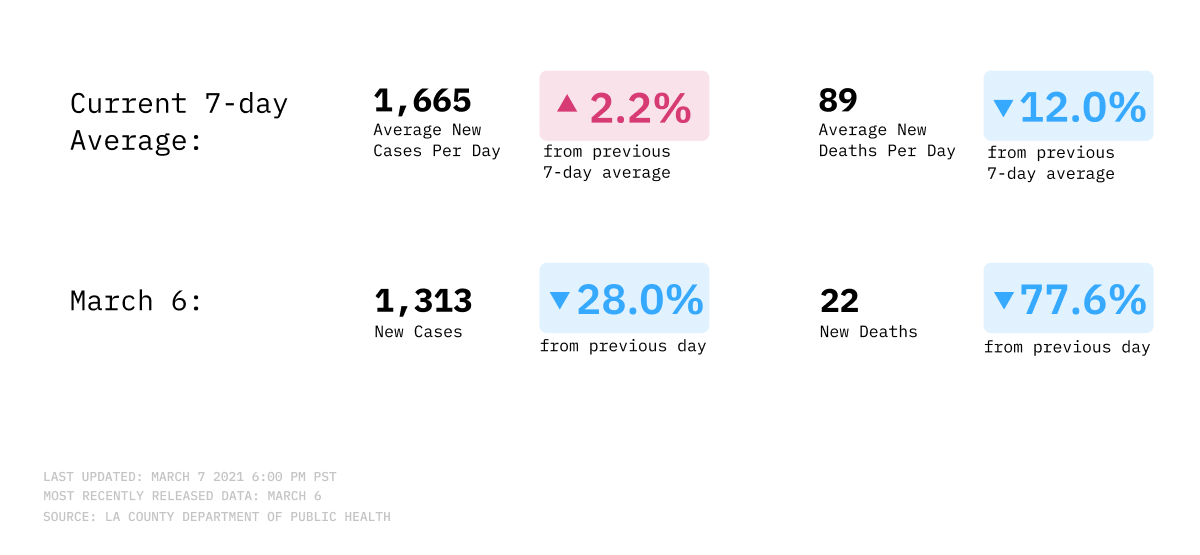
Progress on reducing the number of daily infections is slowing. During the week of Feb. 20-26, the volume of new cases dropped by 47.4% compared with a week prior. However, during the week of Feb. 27-March 5, the drop in news cases from the previous week was 14.1%.
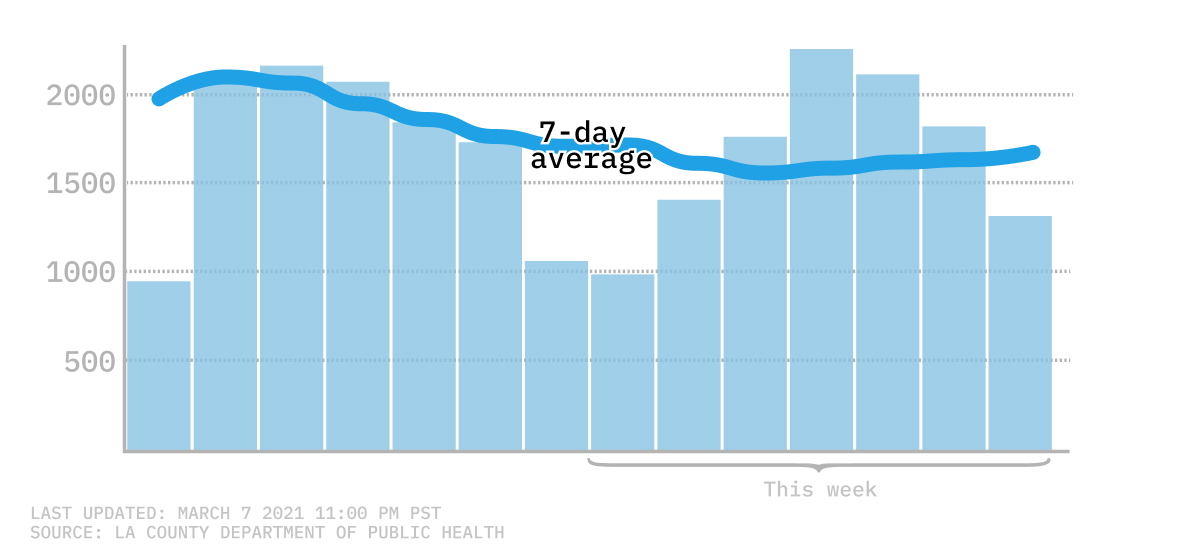
In addition, average COVID-19 cases started increasing again this past Thursday. The seven-day average number of cases hit its lowest point of the year on Wednesday, March 3, with 1,551 new infections. The last time average cases were this low was on Nov. 4, when the average number of cases was 1,473. But by March 6, the seven-day average had crept up to 1,629 new infections.
Seven-day average of new COVID-19 infections
As case numbers fluctuate, COVID-19 deaths in Los Angeles County remain high. On March 6, Public Health announced that the county had reached the grim milestone of 22,000 total deaths over the course of the pandemic. This number is expected to keep increasing, as the seven-day average number of COVID-19 deaths is still above 100 per day. Nonetheless, the 100 average deaths reported on March 5 is still a major improvement from the four weeks prior; on Friday Feb. 5, the average number of COVID-19 deaths was 207, marking a 51.6% decrease.
Hospitalizations
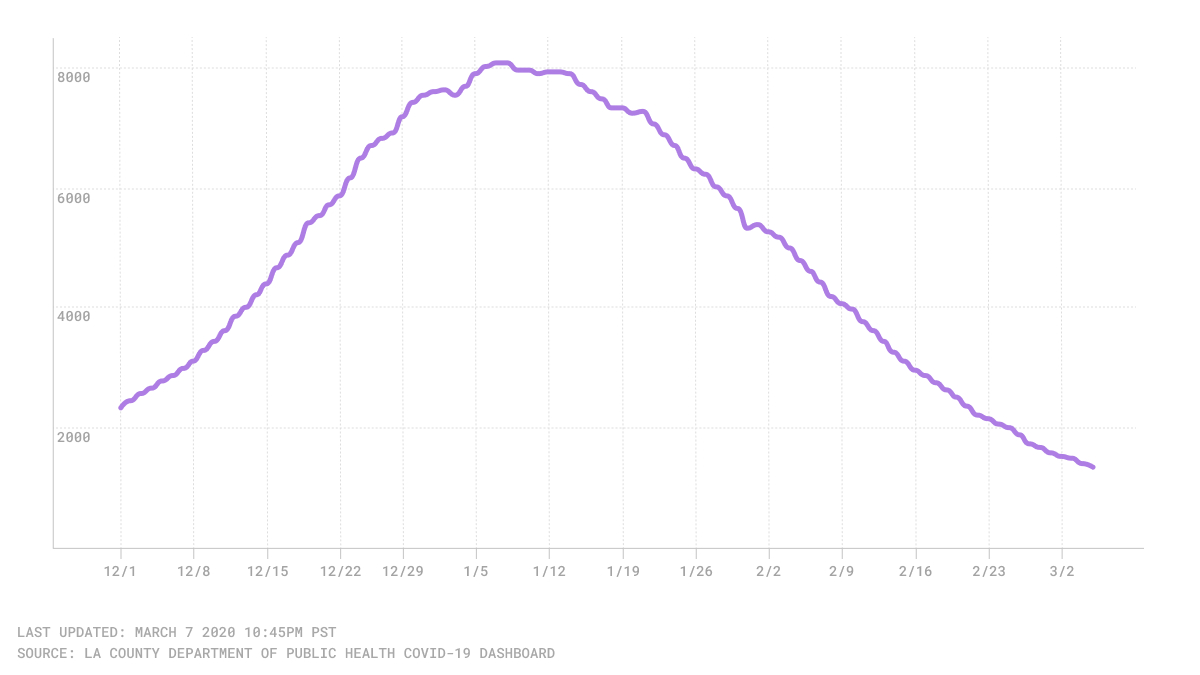
The three-day average of hospitalizations due to the virus are decreasing steadily. Over the past two weeks, hospitalizations have nearly been cut in half. On Friday, March 5, the Department of Public Health reported 1,341 hospitalizations, a 49.2% decrease from the 2,640 hospitalizations reported on Feb. 19. This is also a 83.0% drop from the number of COVID-19 hospitalizations two months prior, when the county had 7,898 average hospitalizations on Jan. 5.
Three-day average of countywide COVID-19 hospitalizations
How We Did It: We analyzed coronavirus data related to new cases, deaths, hospitalization and vaccinations data provided by the Los Angeles County Department of Public Health.
Interested in our data? Check out the Crosstown coronavirus interactive map or email us at askus@xtown.la.


