The Crosstown COVID Tracker
Los Angeles County has now graduated into the state’s less restrictive red tier for the first time – a marker of progress in combating COVID-19. To keep you up to date, here is our weekly rundown of the most important local data on vaccinations, new cases, and hospitalizations.
Vaccinations
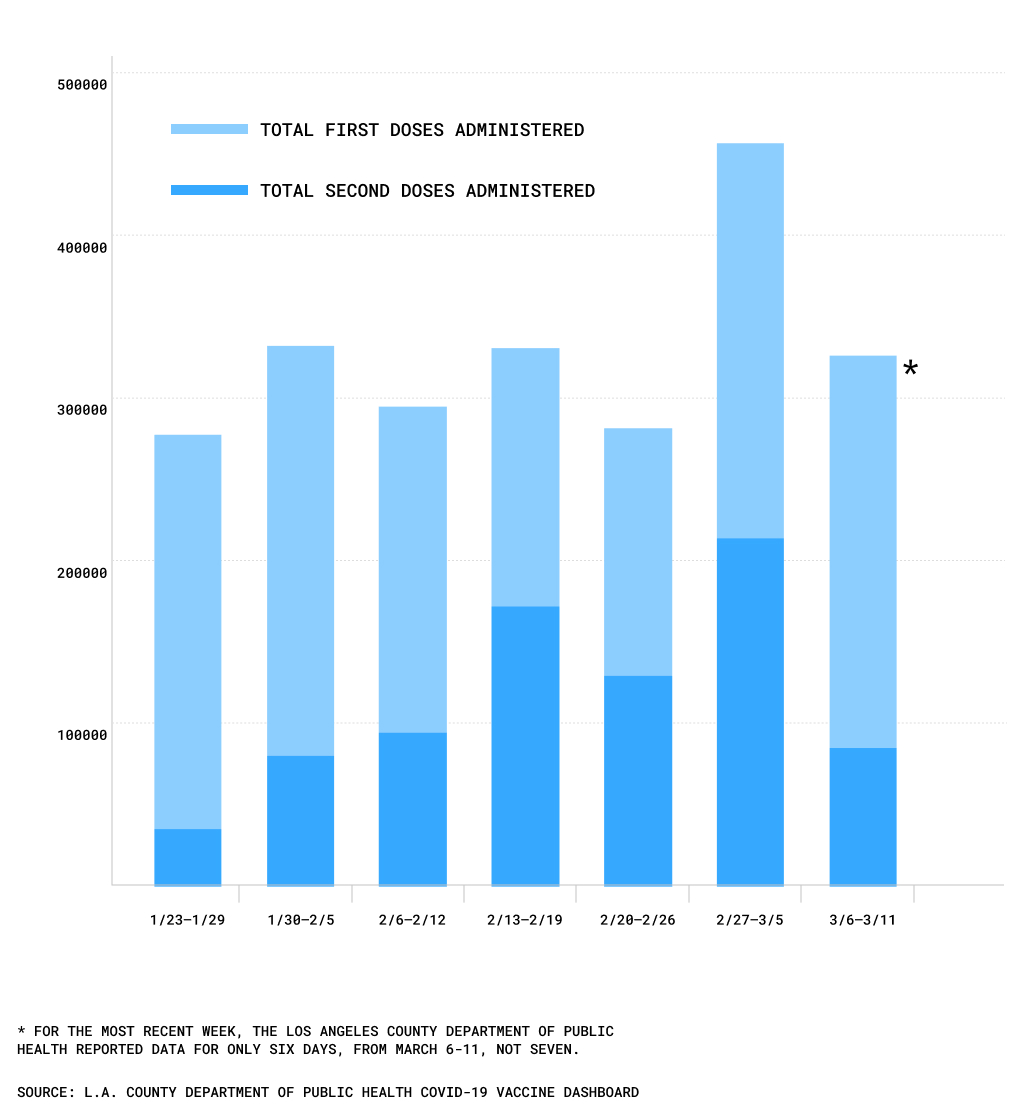
This past week, the pace of administering vaccines slowed as supplies tightened. But exactly how much it slowed by is unclear. That’s because the Los Angeles County Department of Public Health reported the total number of doses it delivered over the course of six days, instead of the usual seven.
Vaccine doses administered in Los Angeles County by week

Over the seven-day period of Feb. 26–March 5, the county administered 456,913 total doses, with 214,096 of them being second doses. The most recent week’s data only extends for a six-day period, ending on March 11. Over this timeframe, however, Los Angeles County only administered 326,117 vaccines, 84,934 of them being second doses. Though it’s difficult to compare these two timeframes, this most recent week shows a considerable drop in second doses.
Cases and Deaths

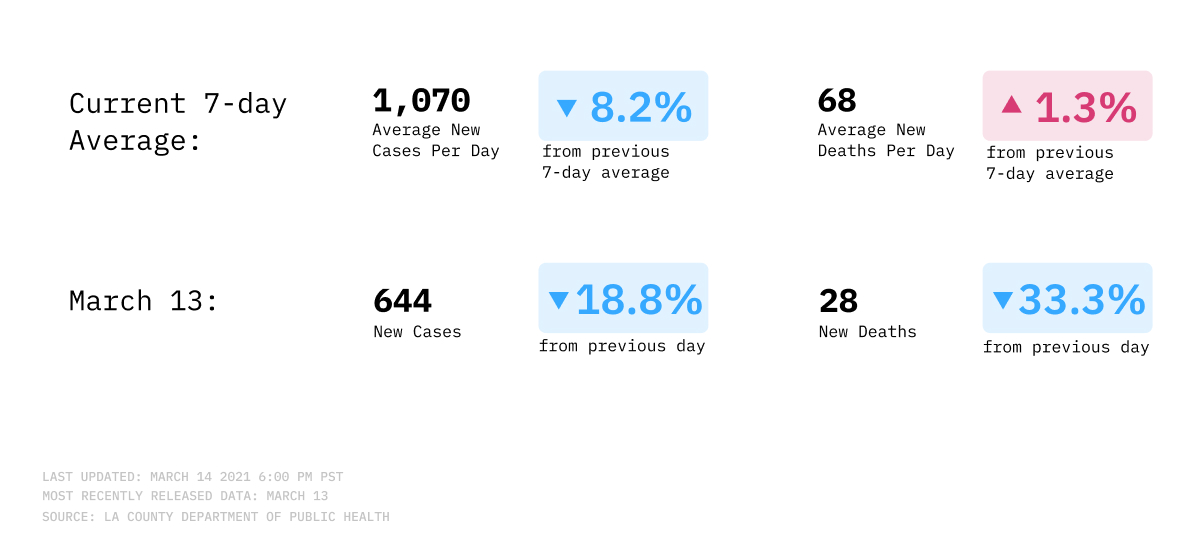
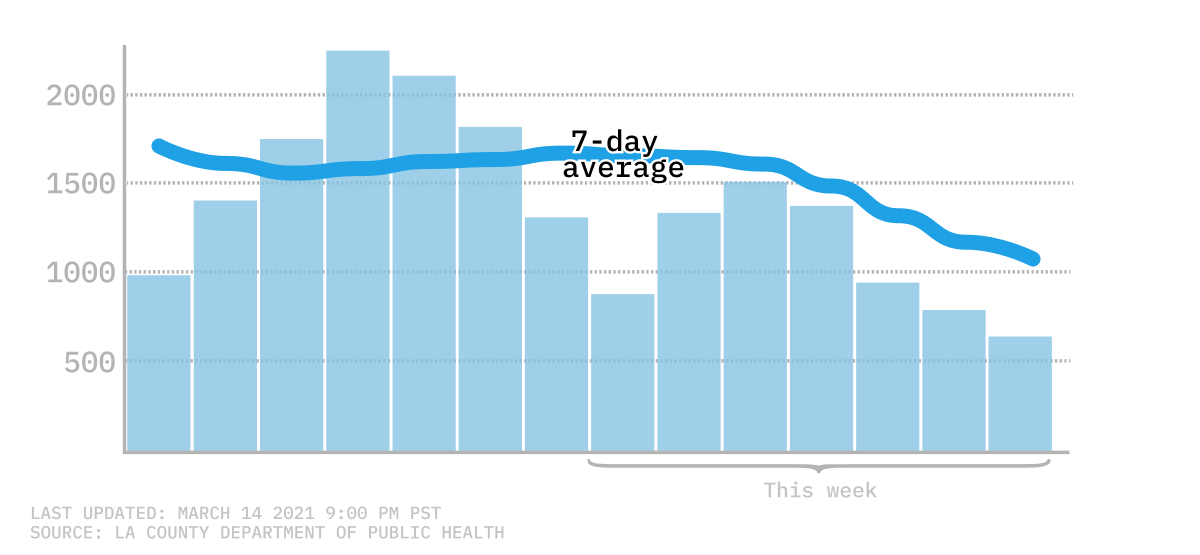
Earlier this month, the number of daily infections had been creeping up. But average COVID-19 cases now appear to be showing downward movement once again.
As of March 13, the seven-day average of new infections was 1,166. That’s a 30% drop from the March 7 average of 1,551. The last time average cases were this low was on Oct. 22, when the seven-day average was 1,170.
Seven-day average of new COVID-19 infections

The county hit another noteworthy milestone this week: The daily reported case numbers have not exceeded 2,000 since Saturday, March 6. This makes the week of March 7-13 the first to not include daily case figures over 2,000 since October 25-31. While the number of new cases reported in these weeks is still higher than those in September, we’re starting to see a return to pre-surge COVID-19 figures.
The death count still remains high in Los Angeles County. But the daily averages for COVID-19 deaths are on a promising downward trajectory. On Sunday, March 7, the seven-day average for COVID-19 related deaths finally dipped below 100, with a total of 89. The last day average death figures were below 100 was Dec. 28, barely hitting the mark with 99 deaths. Most recently, the seven-day average for COVID-19 deaths was 67 on March 13; this marks a 71.2% decrease from the 233 average deaths reported two months prior on Jan. 13.
Hospitalizations
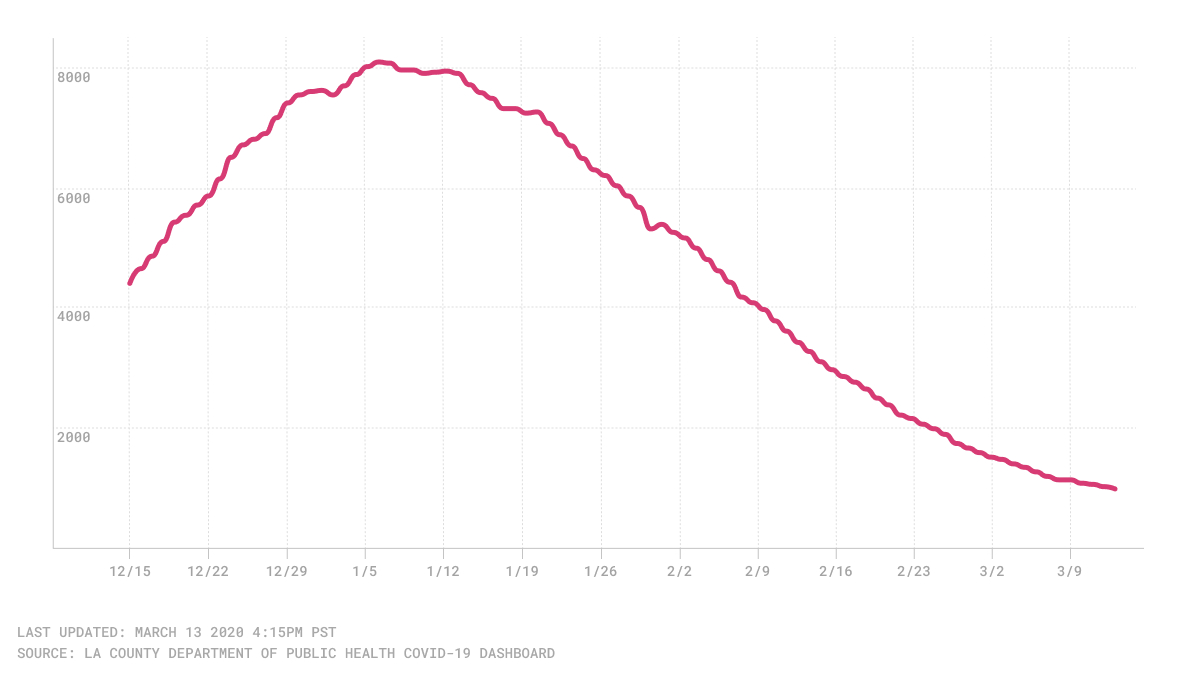
Three-day average of countywide COVID-19 hospitalizations

On Saturday, March 13, LA County officially brought the number of daily COVID-19 hospitalizations below 1,000 for the first time since mid-November. While other figures continue to fluctuate, the three-day average for hospitalizations has been on a steady decline since Feb. 2, when the reported number of hospitalizations was still at 5,259. This marks a drop of 81.4% over the five-and-a-half week period.
How We Did It: We analyzed coronavirus data related to new cases, deaths, hospitalization and vaccinations data provided by the Los Angeles County Department of Public Health.
Interested in our data? Check out the Crosstown coronavirus interactive map or email us at askus@xtown.la.


