

The Crosstown COVID Tracker


Los Angeles County is adjusting to life in the less restrictive red tier, but the COVID-19 landscape changes every day. To keep you up to date, we compile a weekly rundown of the most important local data on vaccinations, new cases, and hospitalizations.
Vaccine doses administered in Los Angeles County by week

Vaccinations
Following last week’s slowdown in coronavirus vaccinations, the county picked up the pace this week and administered a record number of doses. Between March 11–17, Los Angeles County administered 493,412 new vaccinations, 158,267 of which were second doses.
Included in that total are 25,170 of the single-dose Johnson & Johnson vaccines, according to a March 19 Public Health press release.
This week’s vaccination data shows a promising upward trajectory. In the previous period of March 5–10, the county only administered 326,117 new vaccines, with 84,934 of them being second doses. That period was an anomaly, as the county released data only for a six-day period instead of the usual seven.
The success in vaccine distribution this past week allowed Los Angeles County to claim another headline: over 3 million total vaccine doses, with over 1 million being second doses.
Cases and Deaths
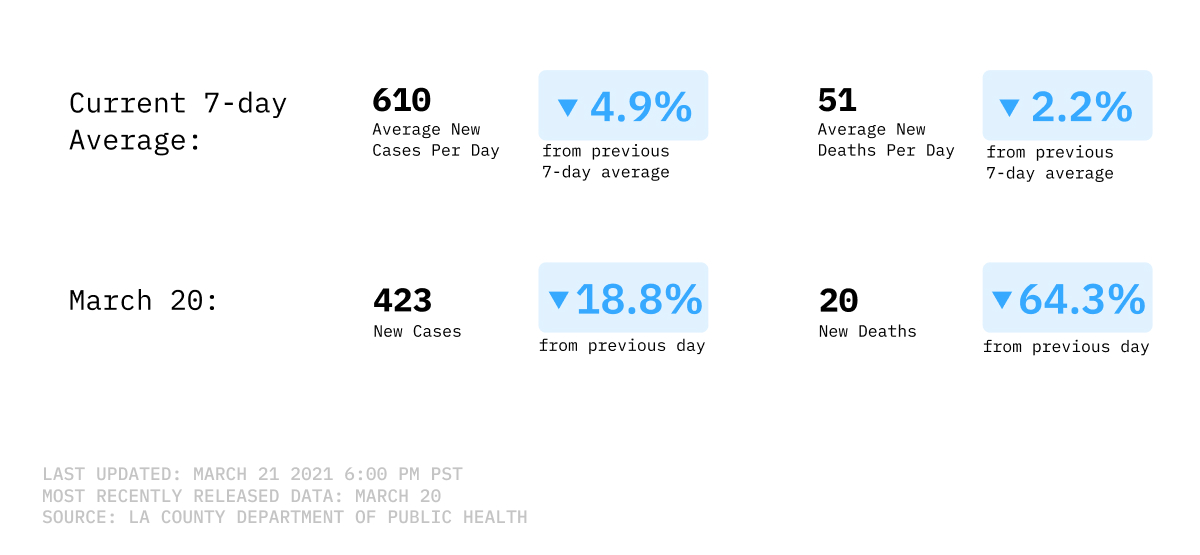
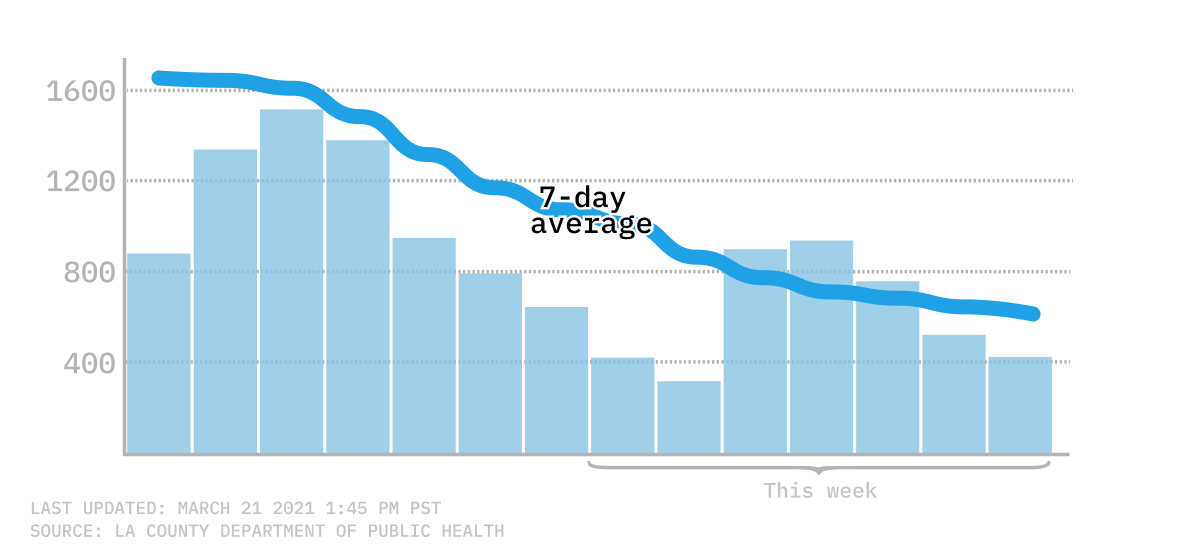
Los Angeles County recorded another steep drop in new COVID-19 infections, reaching pre-summer and winter surge levels. As of March 20, the seven-day average for new COVID-19 cases was 642. This marks a 94.6% drop from just two months prior, when the average was still at 11,819 cases. The last time average cases were this low was on April 20, 2020, with a seven-day average of 654.
This week, the county made further progress, as daily COVID-19 case numbers for the week of March 14–20 didn’t exceed 1,000. The last time this occurred was April 12–19 of 2020.
Seven-day average of new COVID-19 infections
While the death count still remains high throughout Los Angeles County, the seven-day average for COVID-19 deaths is on a promising decline. On Friday, March 19, average deaths hit their lowest point since Dec. 9, coming in at 50 a day. This is a 60.9% decrease from a month prior, on Feb. 19.
In addition, daily figures are also showing progress. In the week of March 14–20, daily COVID-19 death counts remained under 100 for the first time since Dec. 6–13. While these figures are still much higher than those during the summer months, deaths are a lagging indicator, so these numbers should continue to drop in the coming weeks.
Hospitalizations
Three-day average of countywide COVID-19 hospitalizations
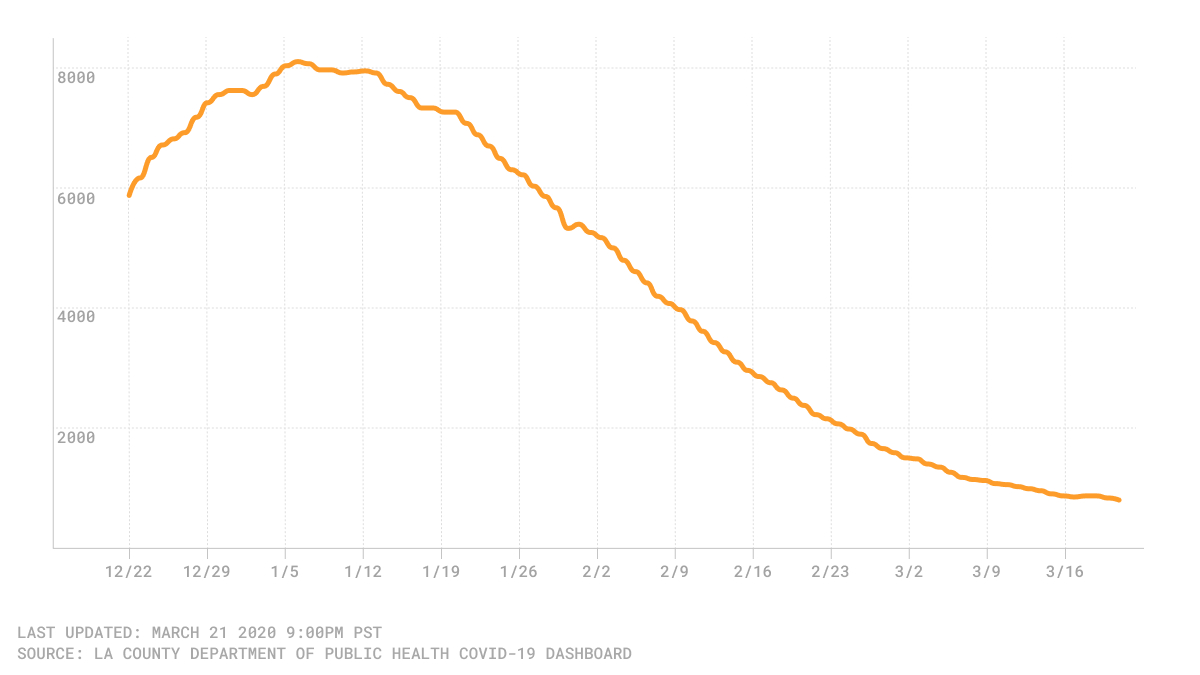
On Saturday, March 20, Los Angeles County reported its lowest number of hospitalizations since Nov. 6, with 827. This marks an 88.6% decrease from two months prior, when, on Jan. 20, there were 7,253 hospitalizations. Last week, the county finally brought the three-day average for hospitalizations under 1,000; since then, hospitalization numbers have moved steadily downward and remained below four digits.
How we did it: We analyzed coronavirus data related to new cases, deaths, hospitalization and vaccinations data provided by the Los Angeles County Department of Public Health.
Interested in our data? Check out the Crosstown coronavirus interactive map or email us at askus@xtown.la.


