

Where in LA is progress on COVID-19 lagging?


Los Angeles County has made vast strides in reducing the number of new COVID-19 infections over the past month. But, as has been the case since the start of the pandemic, neither the pain nor the progress is spread equally.
Generally, Los Angeles’s poorest and most densely packed communities have borne the brunt of COVID-19 cases. Now, results are mixed, and the wealthy communities of Brentwood and Beverly Hills, along with upwardly mobile Silver Lake, are all among the 10 places that registered the slowest progress in battling new infections. In the case of Brentwood, infections actually increased.
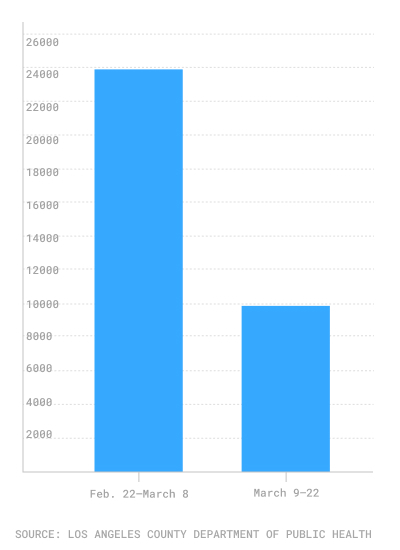
In the two-week period between Feb. 22-March 8, Los Angeles County recorded 23,873 new infections. In the following two-week period, between March 9-22, the number of infections fell 58.7% to 9,853, according to publicly available data from the county’s Department of Public Health. The most recent seven-day average for new cases is 615.
New COVID-19 infections in Los Angeles County
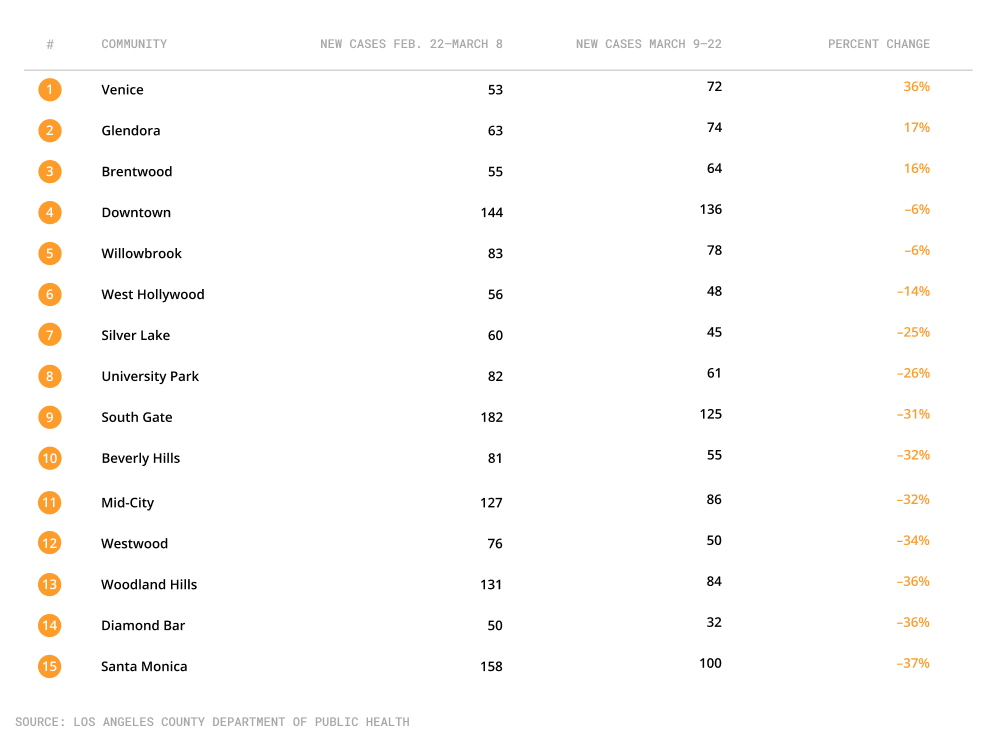
It is worth noting that only eight of 140 neighborhoods with more than 50 new cases in the last two-week period saw the level of infections fall by less than 30%, a testament to the widespread progress. And just three communities saw numbers increase (which could also be related to testing capacity in certain areas); infections in Venice grew by 36% and Glendora’s numbers rose by 17%. Cases fell in Downtown, but only by 6%, far below the county average.
Places with least progress in stopping new COVID-19 infections
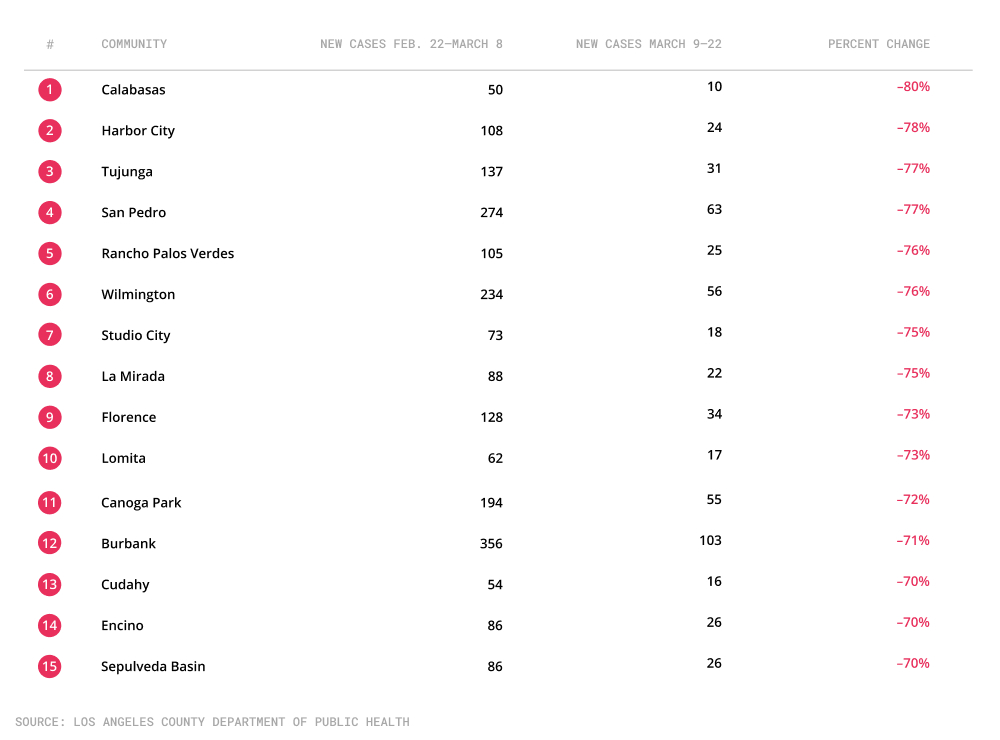
At the other end of the spectrum, Calabassas scored the sharpest decline, moving from 50 cases to just 10 between the two periods, an 80% drop. Other communities with steep decreases included affluent Rancho Palos Verdes (from 105 to 25 infections, a fall of 76%) and the lower-income community of Florence (128 to 34 new cases, a plunge of 73%).
Places with greatest progress in stopping new COVID-19 infections
After a surge in new cases that began in late October, Los Angeles County finally began to reduce the number of daily infections in late January, and the numbers have tumbled since then. At the height of the spike, the county was registering TK cases a day.
The steady decrease over the past month is only one chapter in the long slog of the pandemic. Over the course of the past year, the disease has taken numerous turns. When the Department of Public Health first began releasing data on new infections by community last March, Los Angeles’s wealthiest areas had the highest infection rates. That was largely explained by the fact that testing was not widely available, and more well-off areas had greater access to COVID-19 testing kits.
Several months later, however, the situation was reversed, as infection rates began to spike in lower-income communities, with predominantly Latino neighborhoods home to a large number of essential workers hit particularly hard. Deaths resulting from COVID-19 have also hit Black and Latino communities disproportionately hard.
How we did it: We compared the total number of new cases across 270 communities in Los Angeles County that occurred during each two-week period by using publicly available data from the Los Angeles County Department of Public Health. We then calculated the percent change between the two periods. We restricted our list only to neighborhoods that recorded at least 50 cases during the first period of Feb. 22-March 8 in order not to not have low numbers throw off the percent change.
Have questions about our data, or want to know more? Write to us at askus@xtown.la.


