

The Crosstown COVID Tracker


We try to keep you up to date by compiling a weekly rundown of the most important local data on vaccinations, new cases, and hospitalizations across Los Angeles County.
Vaccine doses administered in Los Angeles County by week

Vaccinations
For the second week in a row, Los Angeles County broke its own record for delivering vaccinations. Between March 18-24, the county administered 559,840 new vaccinations, 174,554 of which were second doses. In addition, a total of 67,016 Johnson & Johnson vaccine doses have been administered, meaning those vaccinated will not require a second dose. In total, Los Angeles County is nearing 4 million vaccinations, at 3,794,829.
These figures are a slight increase from last week’s vaccination data. In the period of March 11-17, the county administered 493,412 new vaccines, 158,267 of which were second doses. At the time, last week had set a record for the county. Over the past two weeks alone, weekly vaccinations have increased by 71.7%.
Vaccine distribution is largely dependent on the supplies the county receives. In a March 26 press release, the Los Angeles County Department of Public Health noted that it expects to receive 21% more doses than it did the previous week. While this is still under the county’s capable capacity for vaccine distribution, the increase in supply is a strong indicator of the county’s ability to keep the momentum going.
Cases and Deaths
![]()
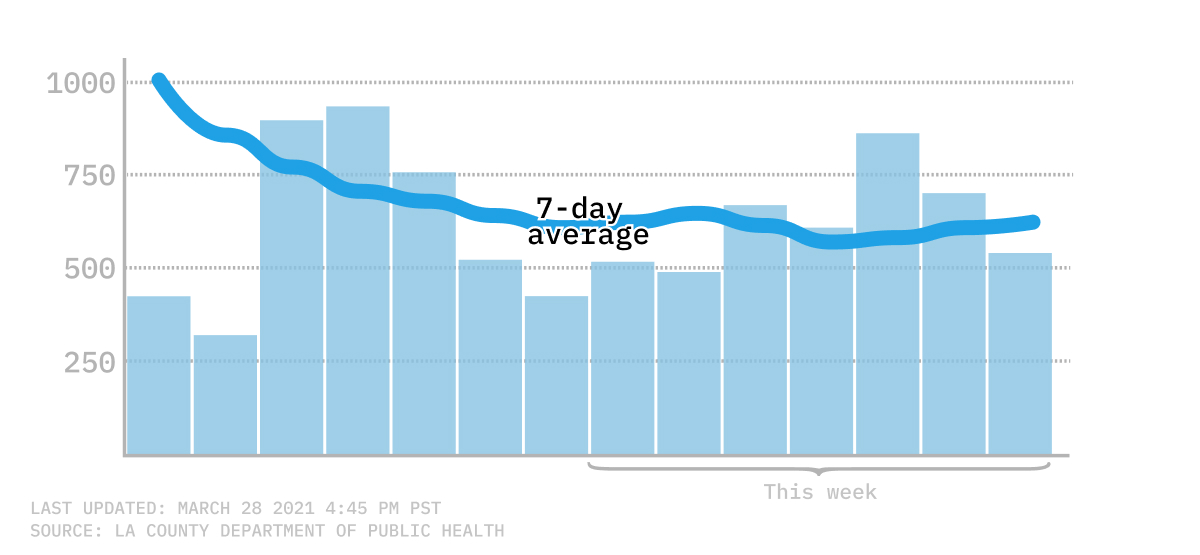
After weeks of a steady drop in cases, COVID-19 infections appear to be reaching a plateau. Daily COVID-19 case numbers have been fluctuating at around 600. As of March 27, the seven-day average for new COVID-19 cases was 609, a slight increase from the 569 average cases reported on March 25. Nonetheless, this most recent average marks a 92.4% drop from two months prior, when the average was 8,008 cases.
Seven-day average of new COVID-19 infections
Deaths remain high in Los Angeles County, but the seven-day average continues to show a promising downward trend. On Saturday, March 27, the county reported an average of 45 deaths, dipping below 50 for the first time since Dec. 9. This marks a 79.4% decrease from two months prior, on Jan. 27.
Hospitalizations
Three-day average of countywide COVID-19 hospitalizations

Unlike new cases, hospitalizations have remained on a steady decline. On Saturday, March 27, Los Angeles reported a new low for hospitalizations, at 676. The last time hospitalizations were this low was Oct. 5. This is also an 89.1% decrease from two months prior, when there were 6,213 reported hospitalizations on Jan. 27. While this is great progress, hospitalizations marginally increased on March 24-25, indicating that we may start seeing a plateau in hospitalizations, as well as cases.
How We Did It: We analyzed coronavirus data related to new cases, deaths, hospitalization and vaccinations data provided by the Los Angeles County Department of Public Health.
Interested in our data? Check out the Crosstown coronavirus interactive map or email us at askus@xtown.la.


