

The Crosstown COVID Tracker


We keep you up to date by compiling a weekly rundown of the most important local data on new cases, vaccinations, and hospitalizations across Los Angeles County.
Cases and Deaths
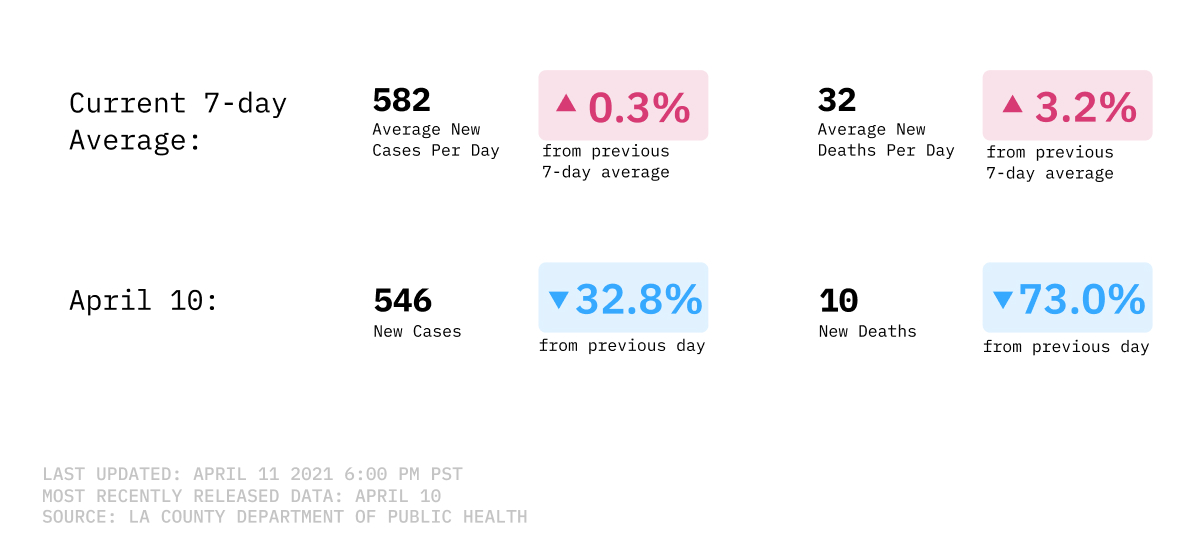
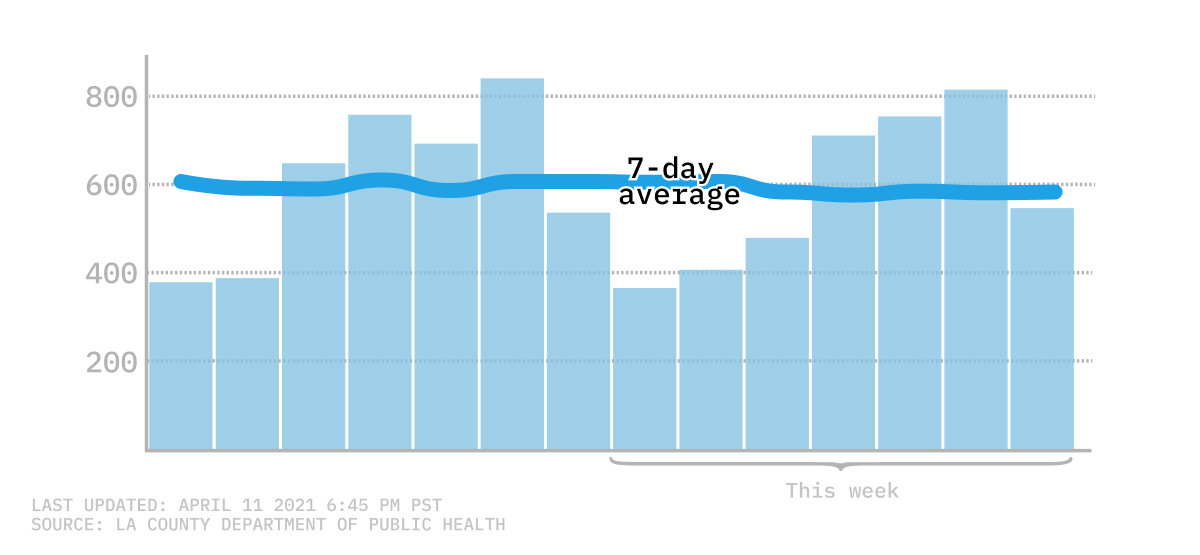
Progress in Los Angeles County has slowed, but even marginal gains are an improvement. As of April 10, the seven-day average for new cases was 580, a slight decrease from the 605 average cases reported seven days prior. The most recent seven-day average marks a 96.1% decrease from the nearly 15,000 average cases three months ago, on Jan. 10. Daily case rates also show a promising trend: The last time Los Angeles County reported over 1,000 cases in a single day was March 11, over a month ago.
Seven-day average of new COVID-19 infections
This week, the seven-day average for COVID-19 related deaths plateaued in the low 30s. On Saturday, April 10, the county reported an average of 31 deaths. April 1 still holds the record for lowest average deaths, at 27, but recent figures still mark an 85.4% decrease from the 212 average deaths reported on Jan. 10. The daily death rates reveal another indicator of progress: The last time Los Angeles County reported a daily death figure over 100 was March 12.
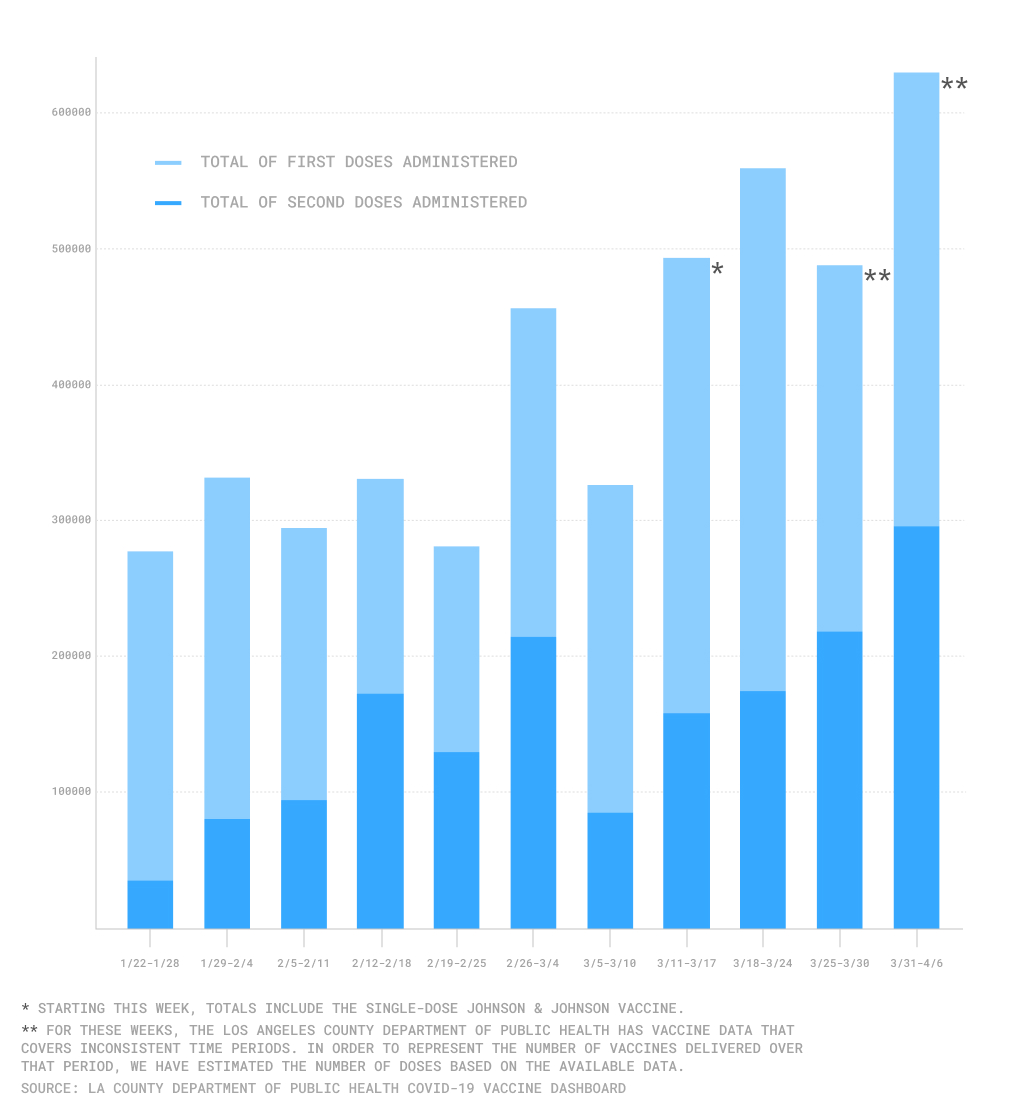
Vaccine doses administered in Los Angeles County by week
Vaccinations
At this point, Los Angeles County has likely administered more than 5 million vaccinations to date. As of April 6, the most recent date for which data is available, 4,913,321 doses have gone into arms, 1,746,103 of which were second doses. At least 136,232 of them were the single-dose Johnson & Johnson vaccine. Based on Los Angeles County’s current population, this means that 31.5% of residents have received their first dose, and 18.8% of residents have received their second dose or the Johnson & Johnson vaccine.
This last week also appears to mark an improvement in the pace of vaccinations. But exactly how much is difficult to tell. That is because the Los Angeles County Department of Public Health released only three days of vaccination data, from March 25-27, followed by ten days of data, from March 28-April 6. Over the most recent period, Los Angeles County administered 899,800 new vaccinations, 422,417 of which were second doses. (In our vaccination chart, we have estimated the number of doses delivered in each of the last two weeks by using available data.)
One of the reasons why vaccinations accelerated this past week is due to an increase in supply. For the most recent week, 397,430 doses were allocated to Los Angeles County, with 118,000 of them being the single-dose Johnson & Johnson vaccine. In addition to that allocation, the Department of Public Health April 9 press release stated that additional doses were shipped from the federal government directly to Los Angeles County providers, increasing the county’s vaccination capacity to nearly 700,000 doses. The rising supplies arrive just in time for April 15, when vaccine eligibility opens up to every Los Angeles resident above the age of 16.
Three-day average of countywide COVID-19 hospitalizations
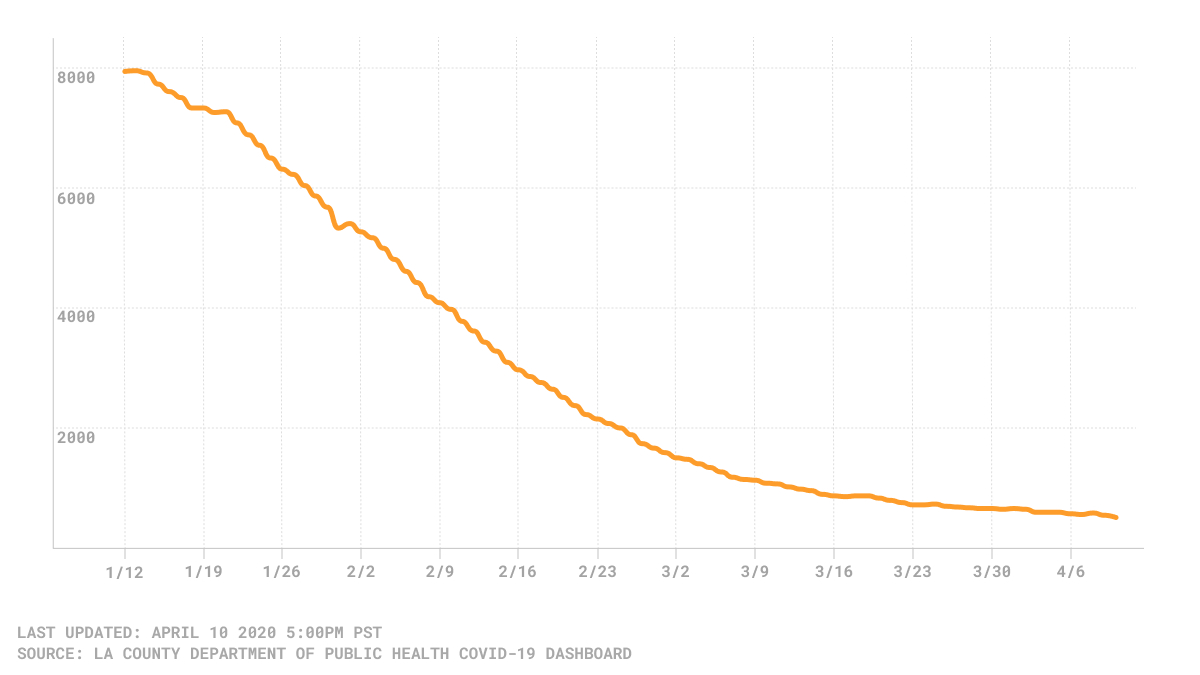
Hospitalizations
COVID-19 related hospitalizations continue on a downward trend. On April 10, the county reported 508 hospitalizations, the lowest figure to date since the early months of the pandemic. This also marks a 93.6% decrease from the 7,964 hospitalizations reported on Jan. 10, three months prior.
How We Did It: We analyzed coronavirus data related to new cases, deaths, hospitalization and vaccinations data provided by the Los Angeles County Department of Public Health.
Interested in our data? Check out the Crosstown coronavirus interactive map or email us at askus@xtown.la.


