

The Crosstown COVID Tracker


We keep you up to date by compiling a weekly rundown of the most important local data on new cases, vaccinations, hospitalizations, and positivity rates across Los Angeles County.
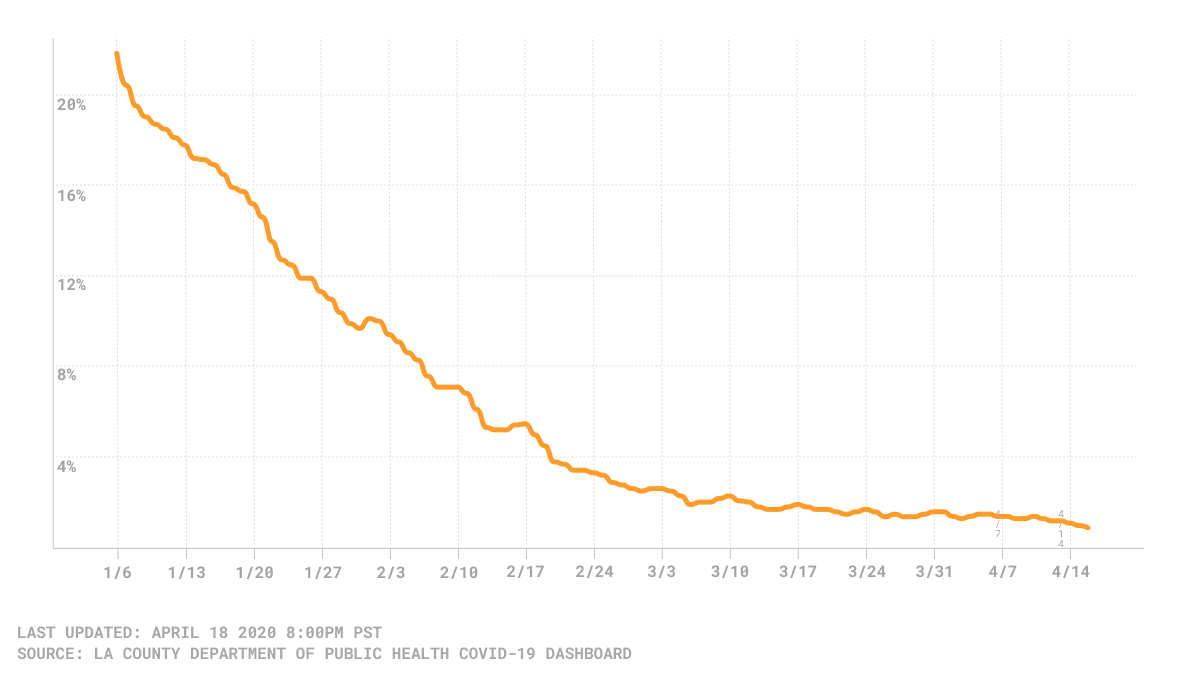
Positivity Rate
On Saturday, April 17, Los Angeles County saw the lowest daily test-positivity rate since it began keeping track at the beginning of the pandemic – 0.9%. (The positivity rate is the percentage of COVID-19 tests that show a positive result for the virus.) This marks a 95.9% decrease from Jan. 6, when that rate was 21.8%. This is the most recent date for which Public Health has made data available.
Los Angeles County daily COVID-19 positivity rate
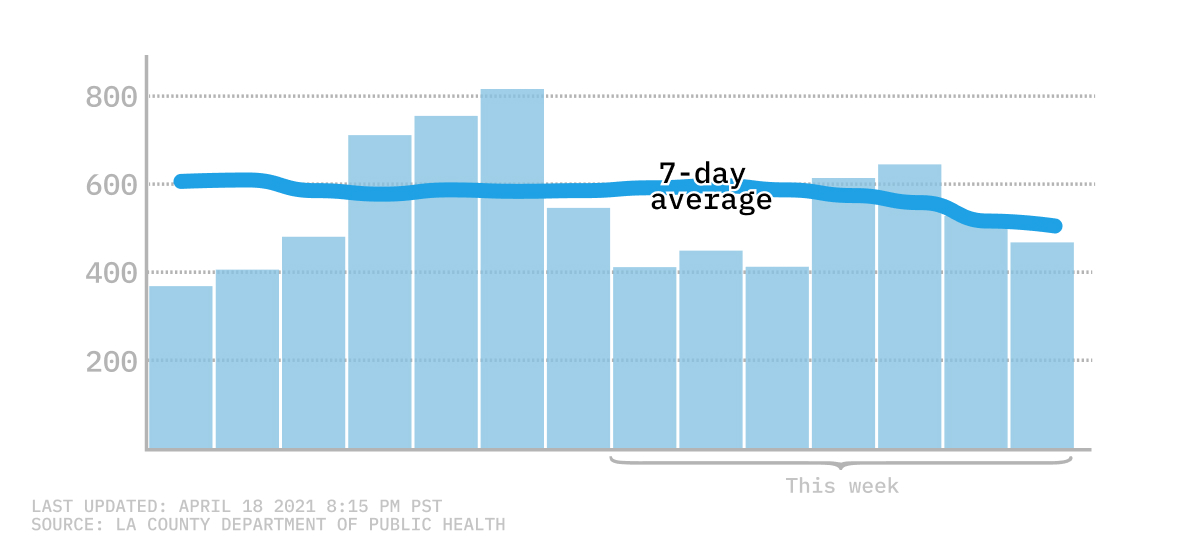
Cases and Deaths
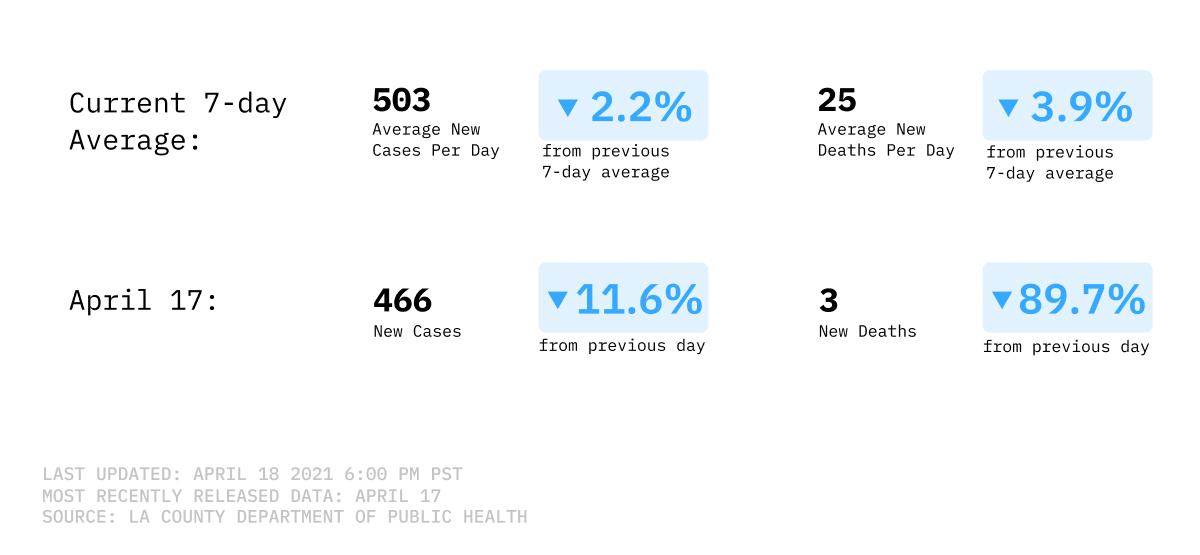
New COVID-19 cases in Los Angeles County might be edging downward after several weeks of being stuck in neutral. As of April 17, the seven-day average for new cases was 514; this marks a 96.3% decrease from the nearly 14,000 three months prior, on Jan. 17. Two weeks ago, the seven-day average was 605. The last time average case numbers were this low was on April 19, 2020, exactly one year ago.
Seven-day average of new COVID-19 infections
The seven-day average for COVID-19 related deaths dipped back below 30 at the end of last week. On Saturday, April 17, the country reported an average of 26 deaths, the lowest figure since Nov. 23. This most recent figure is an 88.7% decrease from the 230 average deaths reported on Jan. 17. Daily death rates continue to stay well below 100, indicating a slow but steady decline.
Vaccinations
This week, Los Angeles County hit the milestone of administering over 6 million vaccines. As of April 13, the most recent date for which data is available, 6,066,166 doses have been administered, 2,134,216 of which were second doses.
Vaccine doses administered in Los Angeles County by week
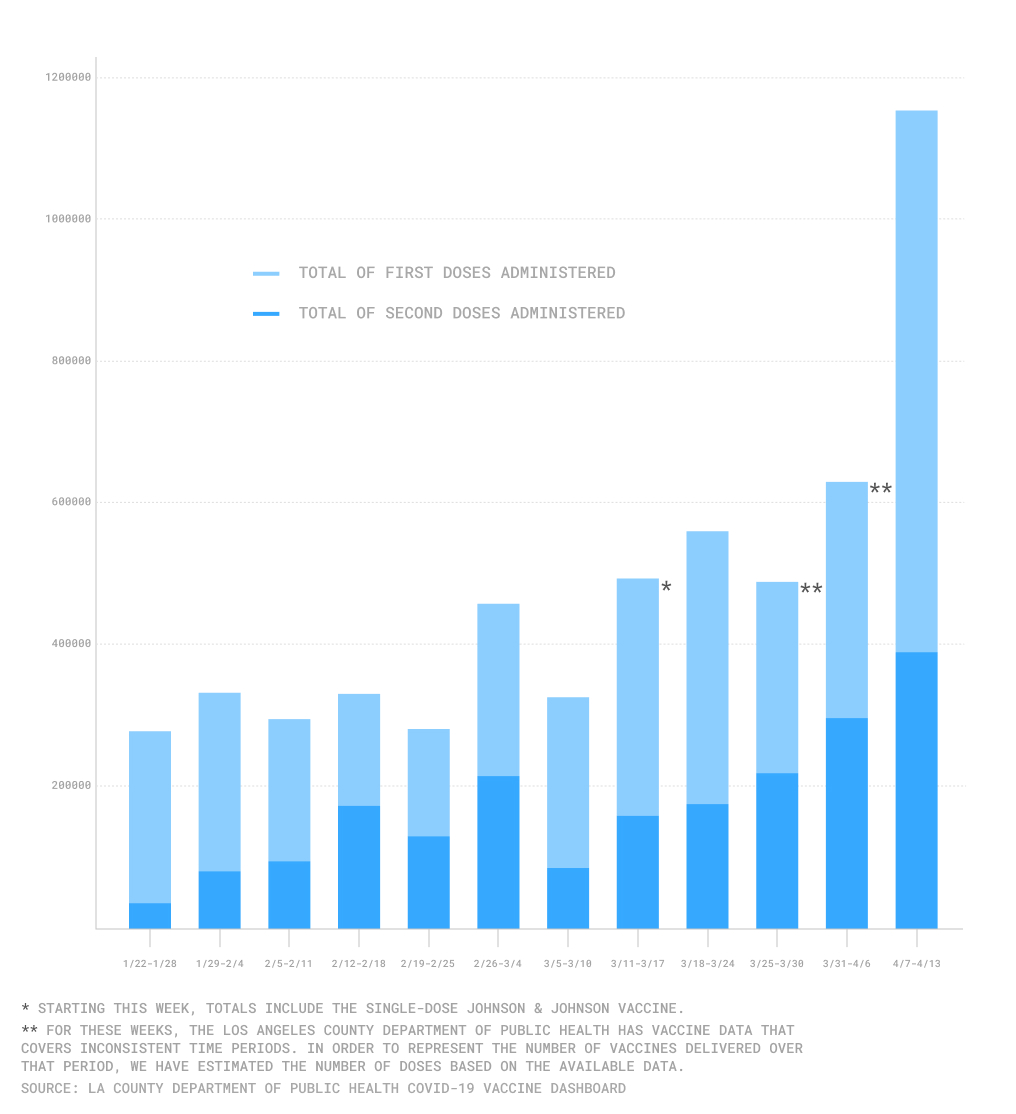
The Los Angeles County Department of Public Health didn’t report how many of those doses were the Johnson & Johnson vaccine. Based on the county’s population, 39.2% of residents have received their first dose, and 21.3% have received their second dose or the single-dose Johnson & Johnson vaccine.
Los Angeles County broke another record: It administered over one million vaccines in a single week. Over the seven-day period April 7-13, the county administered 1,152,845 new vaccines, 388,113 of which were second doses. It is difficult to compare this week’s progress to the two previous weeks, as the county released data on an inconsistent schedule. In our vaccination chart, we have estimated the number of doses administered in each of these two weeks using the data available.
The county owes its accelerating vaccination rate to the recent increase in supply. The Department of Public Health April 16 press release said the county is slated to receive 12% more vaccines this week than last. It is allocating 73% of those doses to the most vulnerable communities. This allocation is in addition to the doses being sent by federal partners and the state.
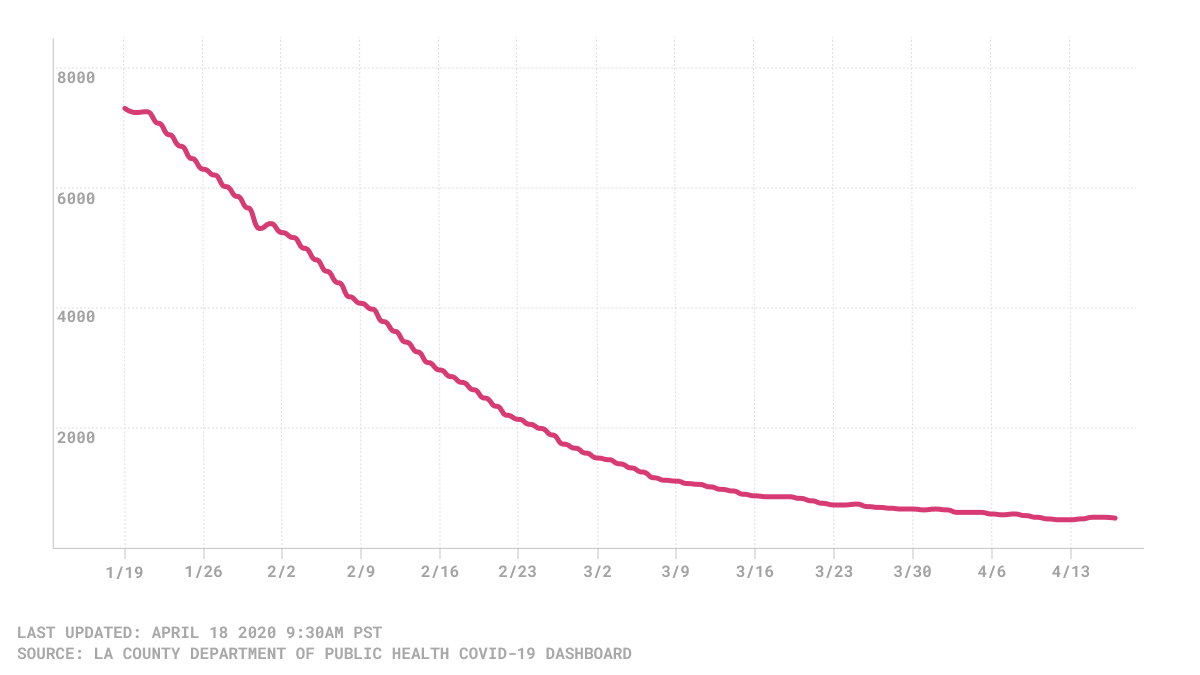
Hospitalizations
After many weeks of a promising downward trend, COVID-19 hospitalizations are starting to flatline. On April 17, the county reported 498 hospitalizations, a slight increase from the 470 hospitalizations reported five days prior, on April 12. Nonetheless, this most recent figure marks a 93.3% decrease from the 7,498 hospitalizations reported three months prior, on Jan. 17.
Three-day average of countywide COVID-19 hospitalizations
The decrease in hospitalizations over the past months is felt most acutely among Los Angeles’s older residents. Although they continue to have higher rates of hospitalizations compared with younger residents, the April 14 Public Health press release states that hospitalizations have dropped by 96% for those over 80 years old.
How We Did It: We analyzed coronavirus data related to new cases, deaths, hospitalization and vaccinations data provided by the Los Angeles County Department of Public Health.
Interested in our data? Check out the Crosstown coronavirus interactive map or email us at askus@xtown.la.


