

The Crosstown COVID Tracker


We keep you up to date by compiling a weekly rundown of the most important local data on new cases, vaccinations, hospitalizations, and positivity rates across Los Angeles County.
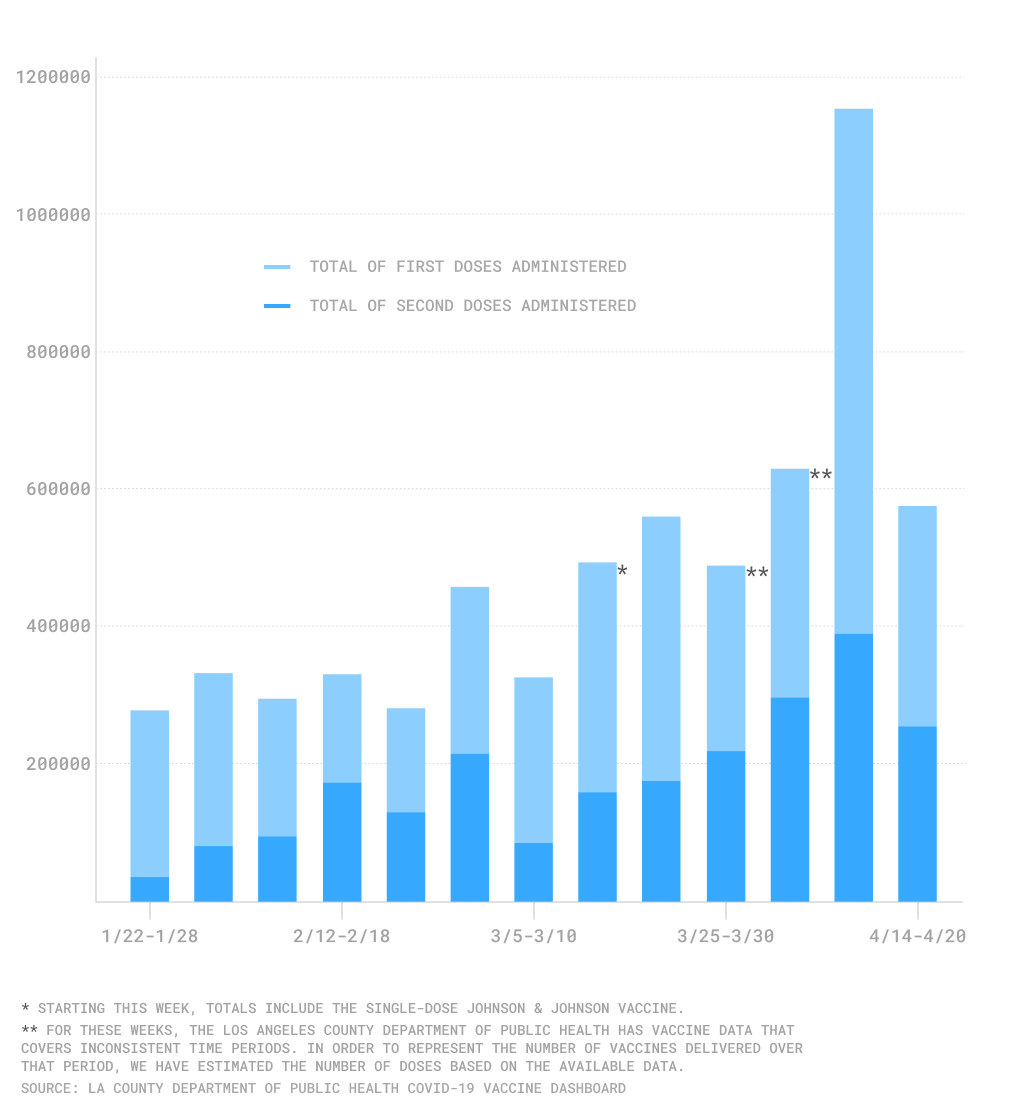
Vaccine doses administered in Los Angeles County by week
Vaccinations
As of April 20, the most recent date for which data is available, 6,641,945 vaccines have been administered, 2,387,785 of which were second doses. This comes just one week after the Los Angeles County Department of Public Health announced that the county had reached 6 million vaccinations on April 13.
That means that at least 48% of Los Angeles residents aged 16 and older have received their first dose, and 29.6% have received their second dose. Additionally, 74.7% of residents aged 65 and older have received their first dose, and 59.5% are fully vaccinated.
The Department of Public Health also reported that a total of 274,212 doses of the Johnson & Johnson vaccine had been administered before its hiatus on April 13, following the Federal Drug Administration and Centers for Disease Control’s recommendations. Ten days later, on April 23, the county announced its plans to resume using the Johnson & Johnson vaccine.
Over the seven-day period April 14-20, the county administered 575,779 new vaccines, 253,569 of which were second doses. It is difficult to compare this week’s progress to the three previous weeks, as the county released data on an inconsistent schedule. In our vaccination chart, we have estimated the number of doses administered for two weeks using the data available. Nonetheless, this week’s vaccination rate is a decrease from the over one million new vaccines administered from April 7-13.
It’s possible that this slow down is due to the pause in Johnson & Johnson vaccine, in which case one might expect the vaccination rates to increase once again. However, the Department of Public Health April 23 press release stated that the county expects to receive 18% fewer vaccines this week than last. About 75% of these doses are headed to the most vulnerable Los Angeles communities.
Positivity Rate
Los Angeles County daily COVID-19 positivity rate
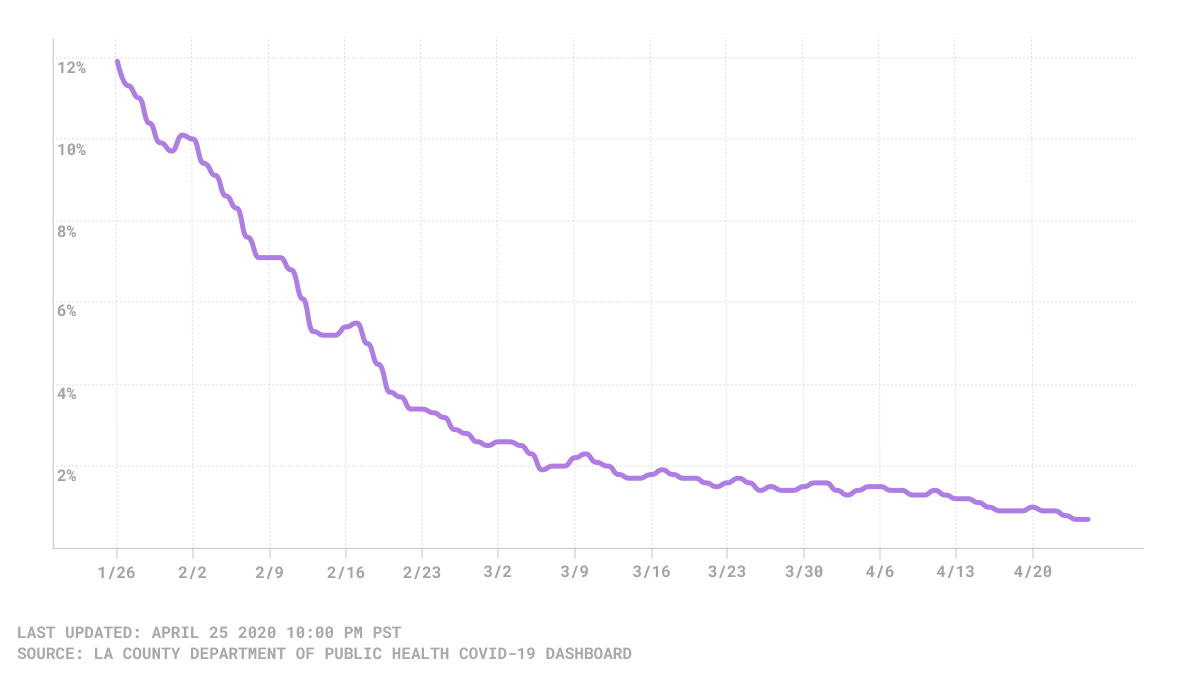
On Saturday, April 24, the county reported a positivity rate of 0.7%, the lowest since the beginning of the pandemic. The county posted another important milestone: As of April 17, the daily test-positivity rate in Los Angeles County has been below 1.0%. (The positivity rate is the percentage of COVID-19 tests that show a positive result for the virus.)
Cases and Deaths
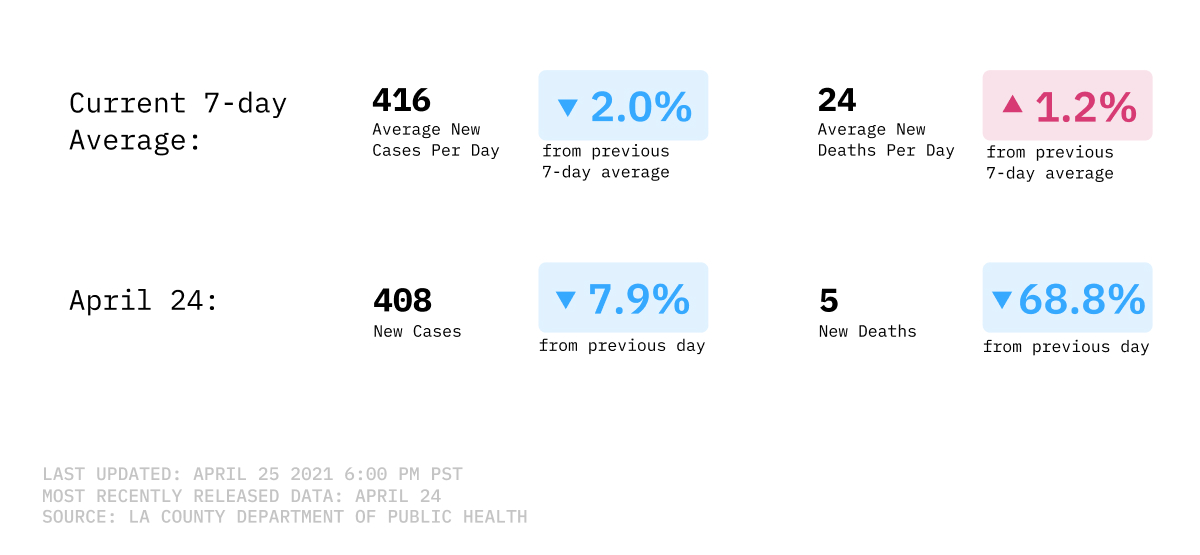
Average COVID-19 cases show a promising decline after weeks being stuck at roughly the same level. As of April 24, the seven-day average for cases was 425, marking a 95.1% decrease from the nearly 8,700 cases three months prior, on Jan. 24. Just two weeks ago, the seven-day average was 580. The last time the seven-day average was this low was on April 2, 2020.
Seven-day average of new COVID-19 infections

Although daily cases often fluctuate, this past week’s figures reflect steady progress for Los Angeles County. Last Saturday, April 17, was the last day new cases came in above 500. Most recently, the county reported 443 new cases on April 24. This is a 94.6% decrease from the 8,243 reported three months prior on Jan. 24.
The seven-day average for COVID-19 related deaths is on a similar downward trend. As of April 24, the seven-day average was 24 deaths, the lowest figure since Nov. 23. This marks a 90.1% drop from when average deaths reached their peak, at 243 on Jan. 14, a little over three months ago. Daily death rates also reveal a promising indicator of progress: For the week of April 18-24, daily deaths remained below 50, something that hasn’t happened since the week of Nov. 15-21.
Hospitalizations
Three-day average of countywide COVID-19 hospitalizations
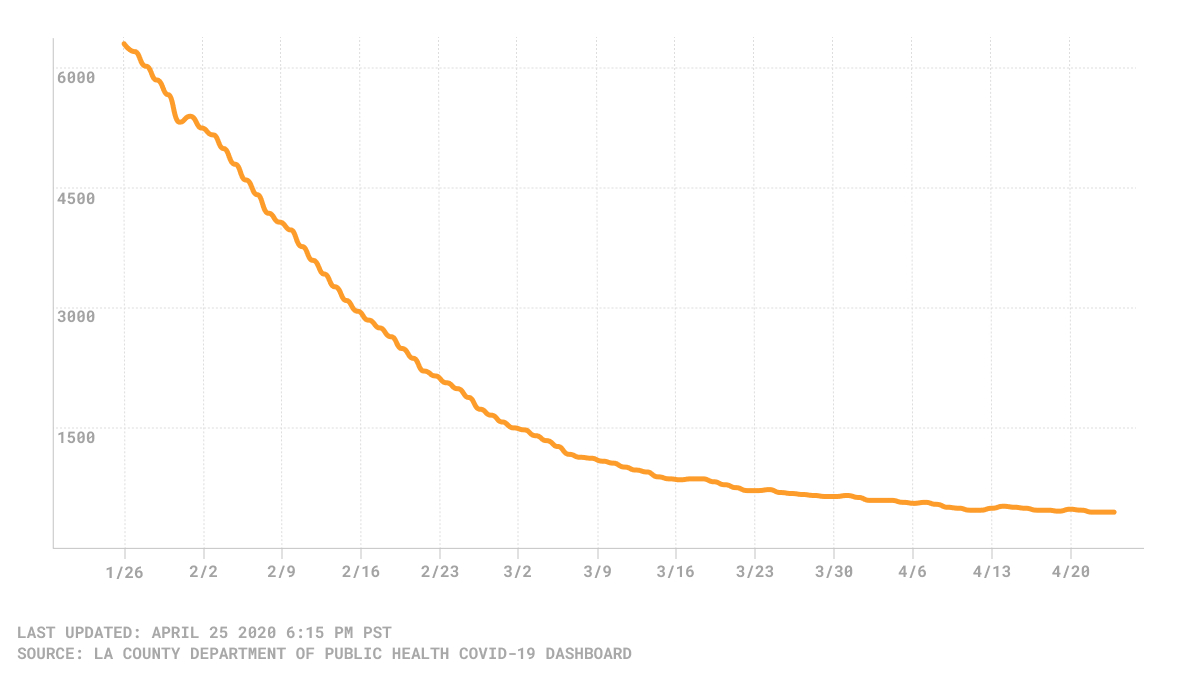
After months of a rapid decline, hospitalizations have begun to decrease at a slower rate. On April 24, the county reported 453 COVID-19 related hospitalizations, a marginal increase from the 451 hospitalizations reported a day prior. Nonetheless, this most recent figure marks a 93.2% decrease from the nearly 6,700 hospitalizations reported three months prior, on Jan. 23. The last time hospitalizations were this low was the beginning of the pandemic last year.
How We Did It: We analyzed coronavirus data related to new cases, deaths, hospitalization and vaccinations data provided by the Los Angeles County Department of Public Health.
Interested in our data? Check out the Crosstown coronavirus interactive map or email us at askus@xtown.la.


