

The Crosstown COVID Tracker


We keep you up to date by compiling a weekly rundown of the most important local data on new cases, vaccinations, hospitalizations, and positivity rates across Los Angeles County.
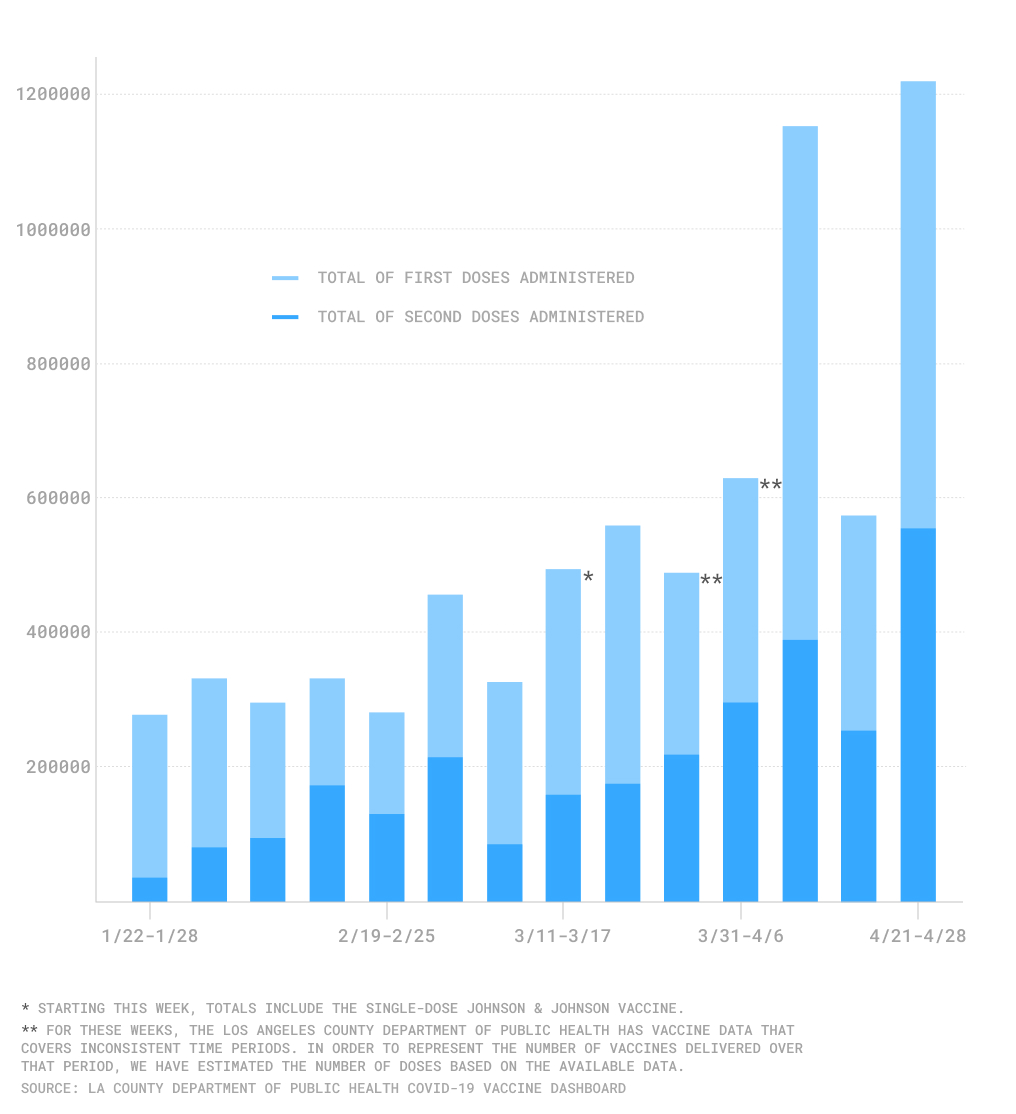
Vaccine doses administered in Los Angeles County by week
Vaccinations
Los Angeles reached a major milestone this past week: Over half of Los Angeles County residents have received their first dose of the vaccine. As of April 28, 53.9% of residents aged 16 and older have gotten their first dose, and 35.8% are considered fully vaccinated. Additionally, 79.2% of residents aged 65 and older have received their first dose, and 64.6% are fully vaccinated.
As of April 28, the most recent date for which data is available, 7,862,893 vaccines have been administered, 2,941,571 of which were second doses. The Los Angeles County Department of Public Health hasn’t reported a recent count of how many single-dose Johnson & Johnson vaccines it has given out since it resumed using them on April 23.
Over the eight-day period April 21-28, the county administered 1,220,945 new vaccines, 553,786 of which were second doses. It’s difficult to compare this week’s progress to the four previous weeks, as the county released data on an inconsistent schedule. In our vaccination chart, we have estimated the number of doses administered for each week using the data available. This week appears to show a sharp increase in new vaccinations. It is also the highest number of second doses in a single week the county has administered to date.
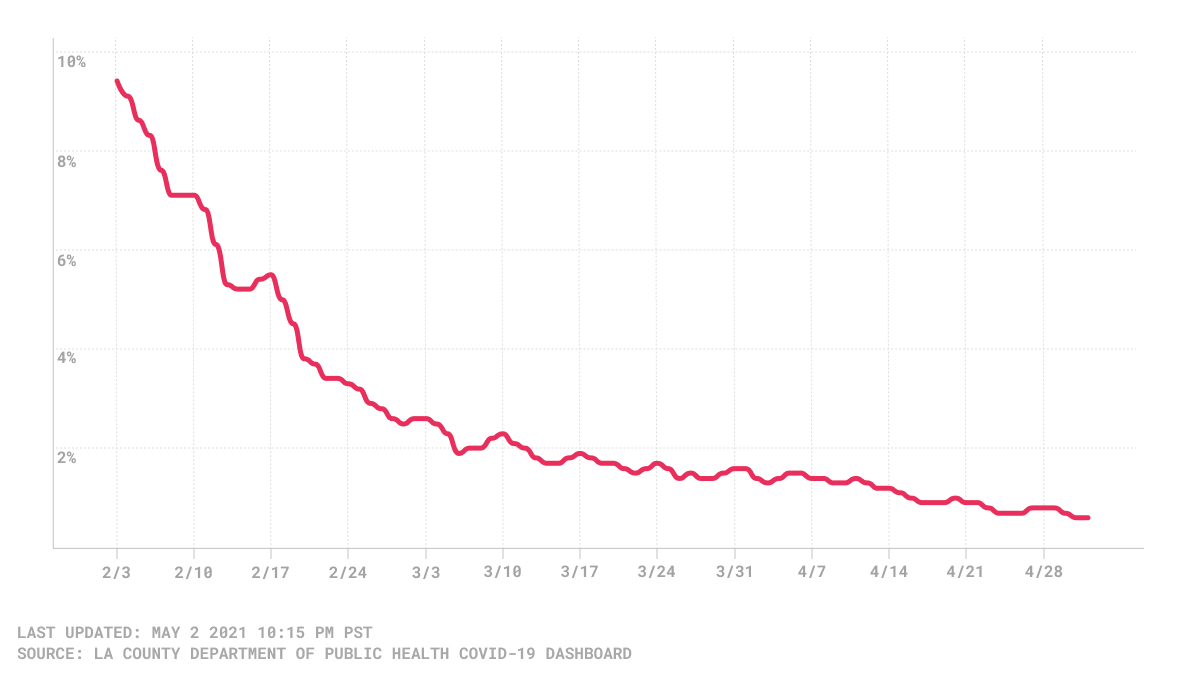
Los Angeles County daily COVID-19 positivity rate
Positivity Rate
The daily test-positivity rate – which has been below 1% for weeks – hit a new low in Los Angeles County. On Saturday, May 1, the county reported a positivity rate of 0.6%, the lowest since the beginning of the pandemic. One of the factors driving the low percentage is the increased testing capacity. Nonetheless, this is a strong indicator of progress. (The positivity rate is the percentage of COVID-19 tests that show a positive result for the virus.) For much of January, the positivity rate was above 20%.
Cases and Deaths
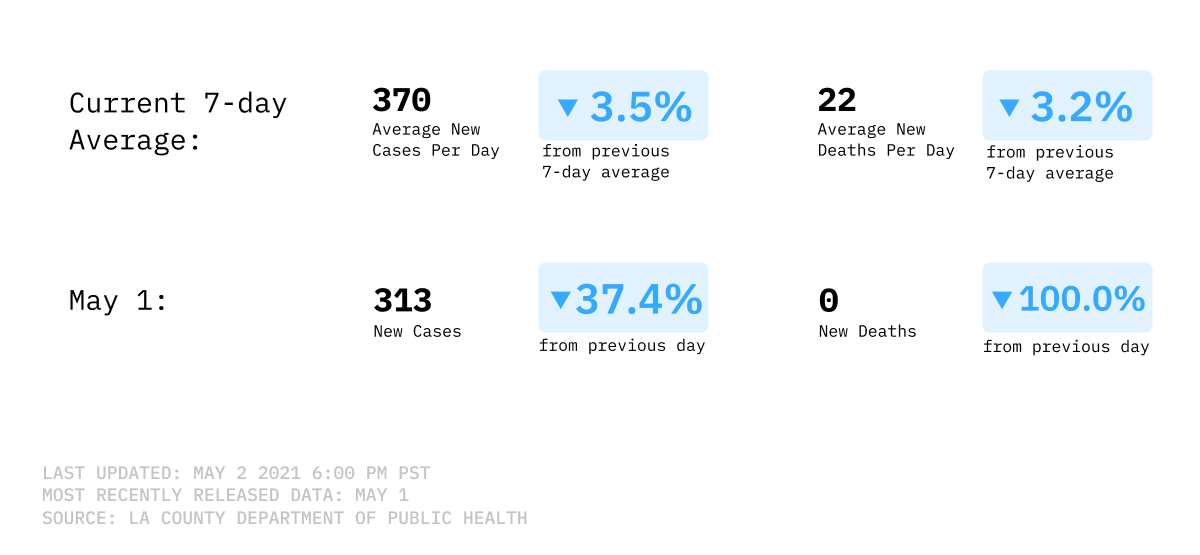
The average number of new COVID-19 infections is shrinking steadily. As of May 1, the seven-day average for cases was 383, marking a 94.2% increase from nearly 6,600 cases three months prior, on Jan. 30. Just two weeks ago, the seven-day average was 514, but this week, average cases dipped below 400 for the first time since April 1, 2020.
The number of cases reported in a single day can still bounce around, ranging from as low as 288 cases on April 26 and to as high as 500 cases on May 1. The last time cases were above 500 was about two weeks ago, on April 17. Most recently, the county reported 313 new COVID-19 cases on May 2, marking a 97.9% decrease from the 15,129 cases reported four months prior on Jan. 2.
Seven-day average of new COVID-19 infections
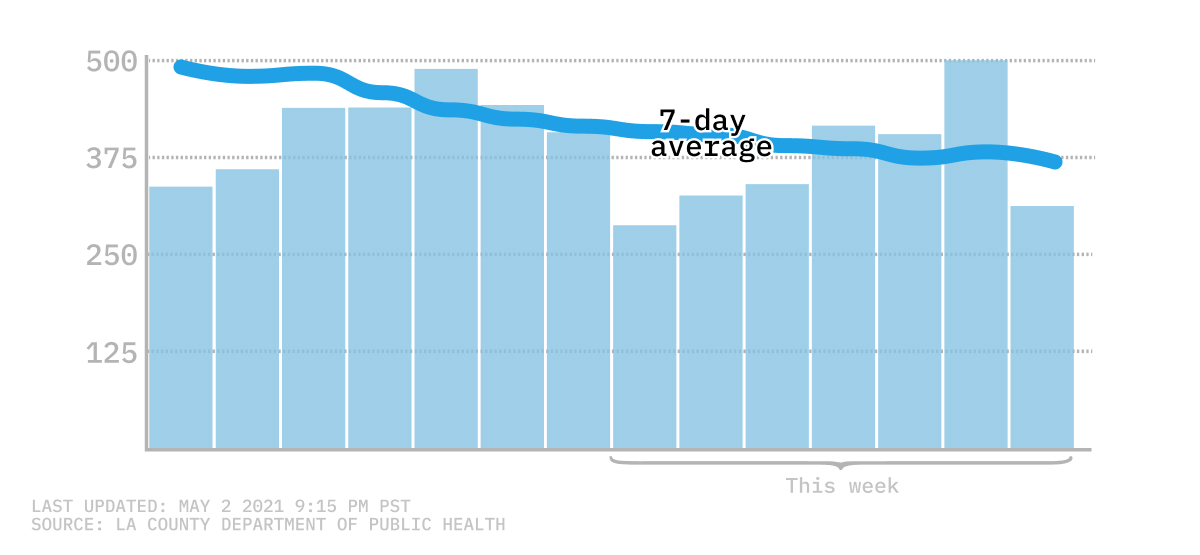
While cases are on a steady decline, the seven-day average for COVID-19 related deaths is starting to plateau in the low 20s. As of April 30, the seven-day average was 21 deaths, the lowest figure since Nov. 19. This marks a 90.2% drop from the 214 deaths reported on Jan. 30, three months prior. Just two weeks ago, the seven-day average was 27 deaths.
On any given day, however, the number of COVID-19 deaths can fluctuate. Most recently, the Department of Public Health reported zero COVID-19 related deaths on May 2, something that hasn’t happened since the very beginning of the pandemic more than a year ago.
Three-day average of countywide COVID-19 hospitalizations
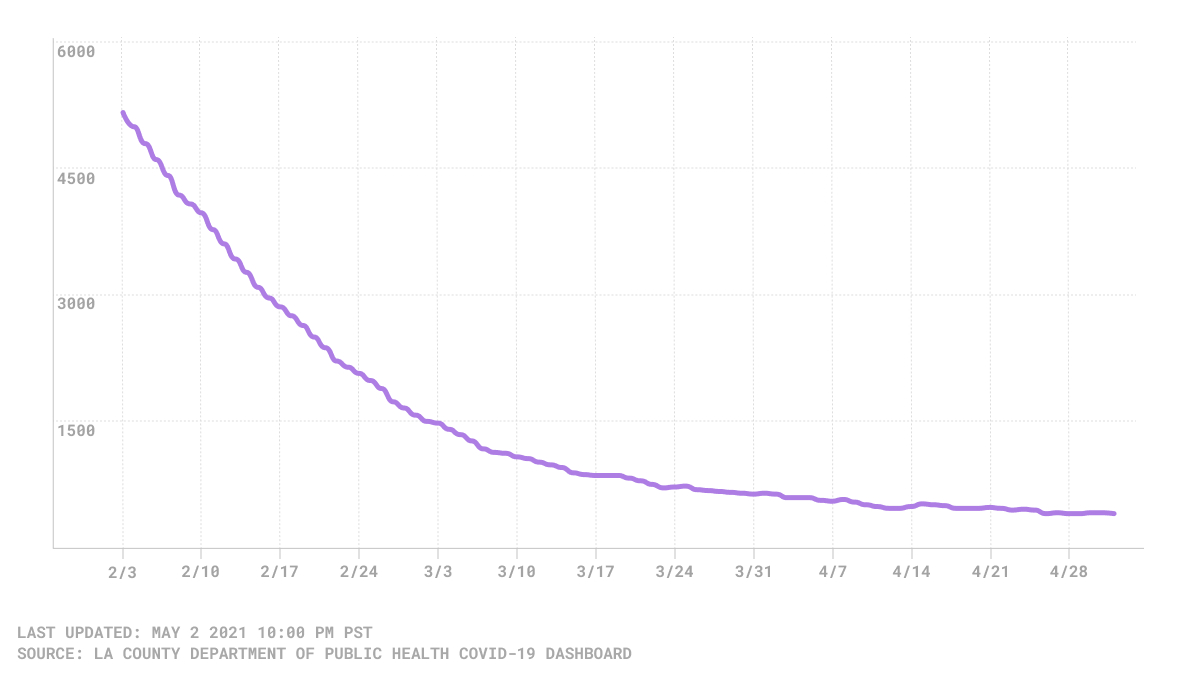
Hospitalizations
COVID-19 related hospitalizations had been dropping sharply but now appear to have flattened out, sitting in the low 400s. On May 1, the county reported 414 hospitalizations, a marginal increase from the 407 hospitalizations reported on April 26 at the beginning of the week. This most recent figure marks a 92.3% decrease from the 5,398 hospitalizations reported three months prior on Feb. 1. The last time hospitalizations were this low was the beginning of the pandemic last year.
How We Did It: We analyzed coronavirus data related to new cases, deaths, hospitalization and vaccinations data provided by the Los Angeles County Department of Public Health.
Interested in our data? Check out the Crosstown coronavirus interactive map or email us at askus@xtown.la.


