The Crosstown COVID Tracker
We keep you up to date by compiling a weekly rundown of the most important local data on vaccinations, positivity rates, new cases, and hospitalizations across Los Angeles County.
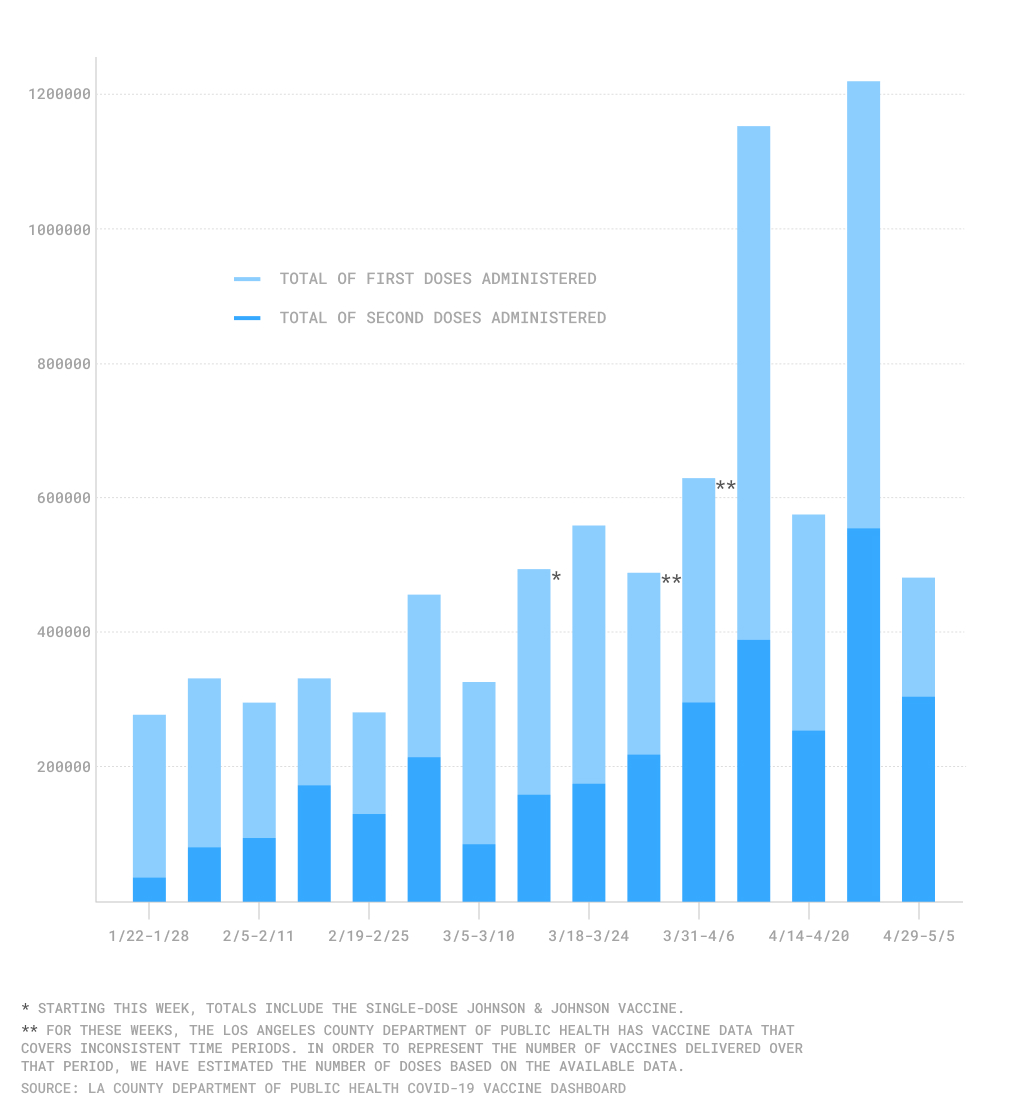
Vaccine doses administered in Los Angeles County by week

Vaccinations
For those of your keeping score at home, Los Angeles County has now administered over 8 million vaccines. As of May 5, the most recent date for which data is available, 8,344,156 vaccinations have gone into arms, 3,245,708 of which were second doses.
To date, 58.2% of Los Angeles residents aged 16 and older have received their first dose, and 40.9% are considered fully vaccinated. This is an increase of more than 10 percentage points from two weeks ago, when around 48.0% of residents had received their first dose and only 29.6% were fully vaccinated. Additionally, 82.4% of residents aged 65 and older have now received their first dose, and 67.8% are fully vaccinated.
What was recently a vaccine supply problem is now a vaccine demand problem. Over the seven-day period April 29-May 5, the county administered 481,263 new vaccines, with 304,137 of them being second doses. This is a significant decrease from the previous periods of April 7-13 and April 21-28, when the county administered more than 1 million doses over each seven-day period. Many county-run and community sites now offer walk-in appointments, and county health officials are even showing up at Metro stops. The decrease in vaccinations, experts believe, is due to hesitancy among those who still have not received a shot.
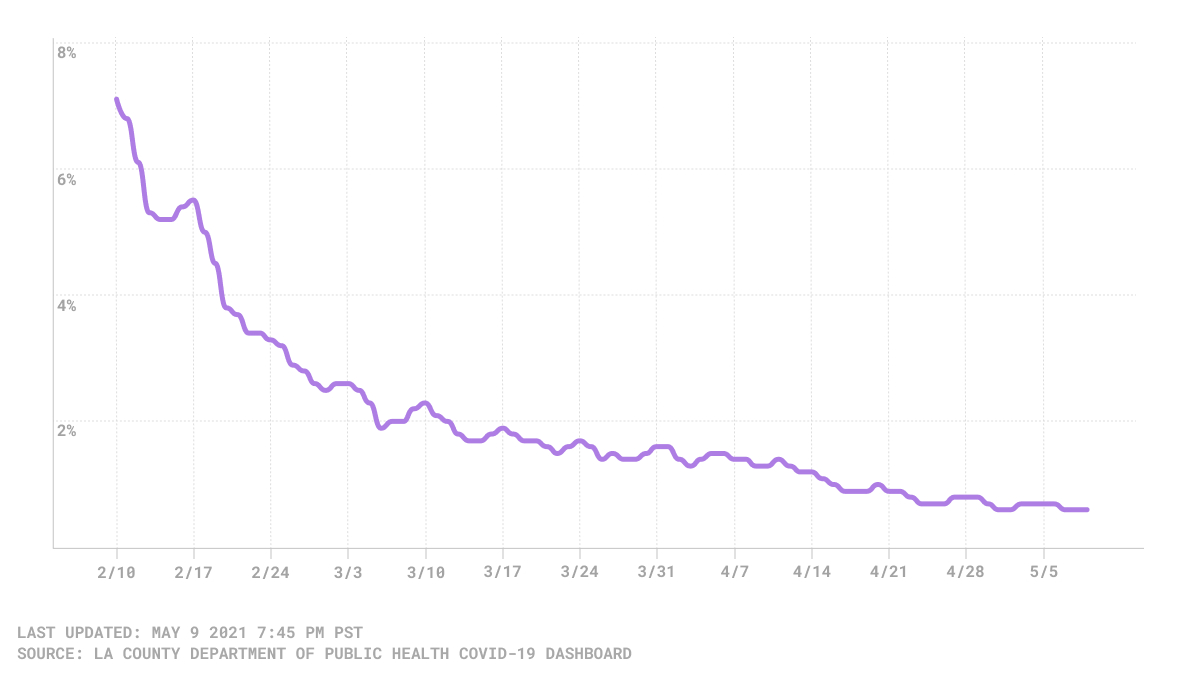
Los Angeles County daily COVID-19 positivity rate

Positivity Rate
The daily test-positivity rate has now been below 1% for nearly three weeks in Los Angeles. As of May 8, the county reported a daily test positivity rate of 0.6%, the lowest since the beginning of the pandemic. The county first reached this positivity rate on Saturday, May 1. Although the decline has slowed, the current rock-bottom positivity rate is good news for the county. (The positivity rate is the percentage of COVID-19 tests that show a positive result for the virus.) At the beginning of January, this rate was above 20%.
Cases and Deaths

The average number of new COVID-19 infections continues to decline. As of May 8, the seven-day average was 340, the lowest figure to date since March 31, 2020. This also marks a 91.9% decrease from the 4,209 average cases three months prior, on Feb. 8. Although the decline may not be as steep as previous weeks, the period of May 2-8 is the first week in which average cases have not exceeded 400 since the Los Angeles Department of Public Health started making COVID-19 data available on March 21, 2020.
Seven-day average of new COVID-19 infections

The number of cases reported in a single day continues to fluctuate between 200-500 for the past three weeks. The last time cases were above 500 was on April 17. Most recently, the county reported 415 new COVID-19 cases on May 8. This marks an 84.9% decrease from the 2,741 cases reported on Feb. 8, three months prior.
After weeks of a plateau, the seven-day average for COVID-19 related deaths has dipped below 20 for the first time since Nov. 19. As of May 8, the seven-day average was 13 deaths, the lowest figure since Nov. 2. This marks a 93% drop from three months prior, when the seven-day average for deaths was 186.
As the number of daily COVID-19 deaths bounces around, Los Angeles County hit two important milestones this past week. For the first time in pandemic history, the county had no new deaths to report on May 1-2. Additionally, the county’s daily death numbers did not exceed 30 on any single day this most recent week. The last time this happened was the seven-day period Nov. 15-21.
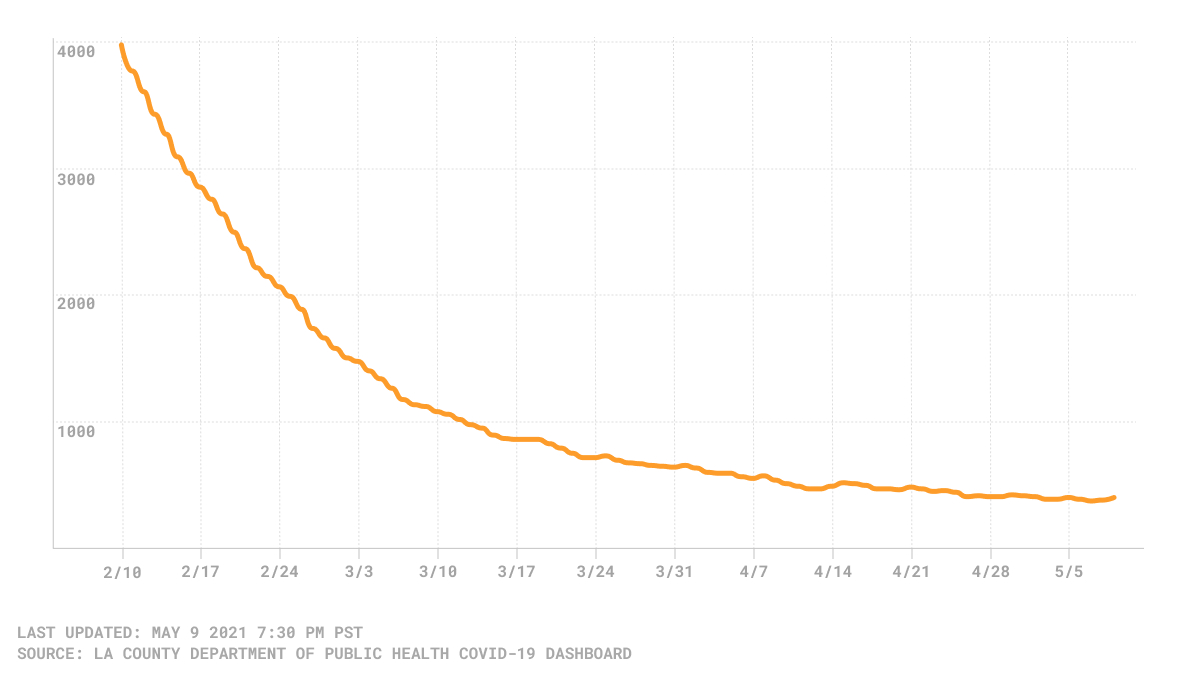
Three-day average of countywide COVID-19 hospitalizations

Hospitalizations
While the decline in COVID-19 hospitalizations had previously been stuck in the low 400s, this figure finally dipped below 400 on May 3 for the first time since the beginning of the pandemic. On May 8, the county reported 379 hospitalizations, a marginal increase from the 376 hospitalizations reported a day prior. This marks a 90.9% decrease from the 4,186 hospitalizations reported on Feb. 8 three months ago.
How We Did It: We analyzed coronavirus data related to new cases, deaths, hospitalization and vaccinations data provided by the Los Angeles County Department of Public Health.
Interested in our data? Check out the Crosstown coronavirus interactive map or email us at askus@xtown.la.


