

The Crosstown COVID Tracker


Los Angeles’s COVID-19 situation is brightening every day. In order to help you keep track of the progress, we compile a weekly rundown of the most important local data on vaccinations, positivity rates, new cases, and hospitalizations across the county.
Vaccine doses administered in Los Angeles County by week

Vaccinations
Herd immunity may finally be on the horizon for Los Angeles County, a figure that health officials place at somewhere around 80%, according to a May 10 press release.
As of May 9, the most recent data available, 59.3% of Los Angeles residents aged 16 and older have received their first dose, and 43.5% are considered fully vaccinated.
This data does not include those vaccinations given to adolescents aged 12-15, as the county didn’t start administering vaccines for this age group until May 13. To date, 82.9% of residents aged 65 and older have now received their first dose, and 68.4% are fully vaccinated.
If the county keeps vaccinating residents at its current rate of 400,000 per week, Los Angeles County may reach this level of community immunity by mid to late July.
As of May 9, a total of 8,629,646 vaccinations have gone into arms, 3,435,058 of which were second doses.
It’s difficult to compare the county’s recent progress to previous weeks. This is because the Los Angeles County Department of Public Health released only four days of vaccination data, from May 6-9, rather than the usual seven. During this timeframe, Los Angeles County administered 285,490 new vaccinations, 189,350 of which were second doses.
Cases and Deaths
![]()
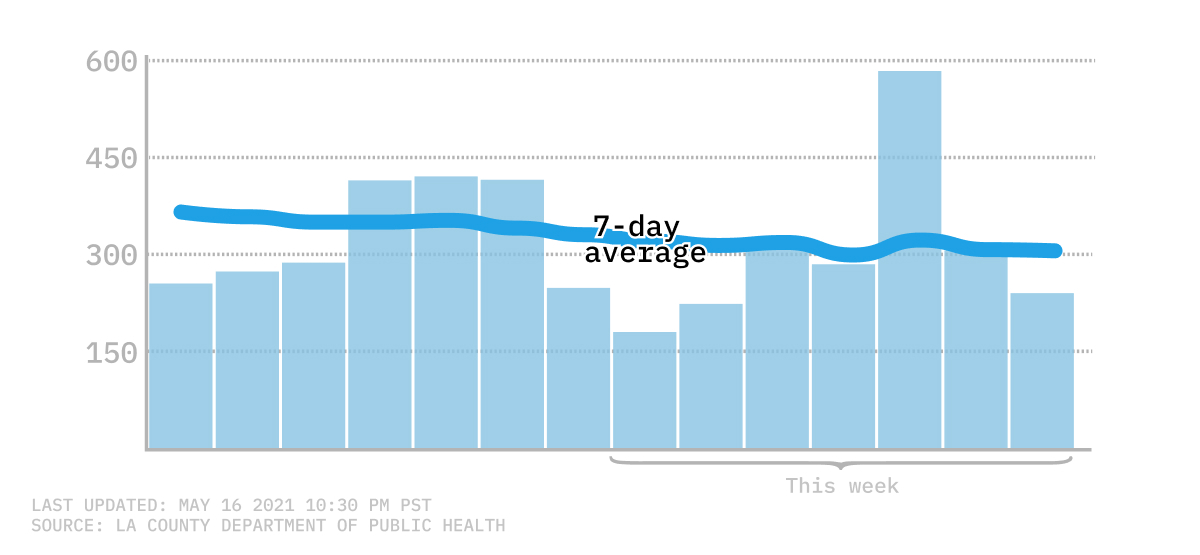
The vaccinations seem to be working. For the first time since March 30, 2020, seven-day average COVID-19 infections dipped below 300 this week. On May 13, the seven-day case average was 299; the figure jumped up again the next day, when 300 backlogged positive test results were reported. As of May 16, the seven-day average was 305, an 88.8% decrease from the 2,677 average cases reported on Feb. 16 three months prior.
The number of cases reported on any single day continues to bounce around. Aside from the 583 cases reported on May 14, which includes the 300 backlogged cases that date back to January, daily figures have remained below 350 over the past week. Most recently, the county reported 240 new COVID-19 cases on May 16. This marks an 80.9% decrease from the 1,260 cases reported on Feb. 16.
Seven-day average of new COVID-19 infections
The seven-day average for COVID-19 related deaths has plateaued once again, but this time around 15 deaths per day. As of May 16, the seven-day average was 14 deaths, a marginal increase from the record-low 13 average deaths reported on May 8. Compared to four months prior, this most recent figure is a 94.1% decrease from the more than 200 average deaths on Jan. 16.
Similar to the number of cases per day, daily death counts continue to fluctuate. Most recently, Los Angeles County reported seven deaths on May 16, an 80.6% decrease from just one month ago. Aside from the 21 deaths reported on May 12, daily figures have remained below 20 this week, often dipping below 10 on the weekends, when fewer sites report their numbers.
Positivity Rate
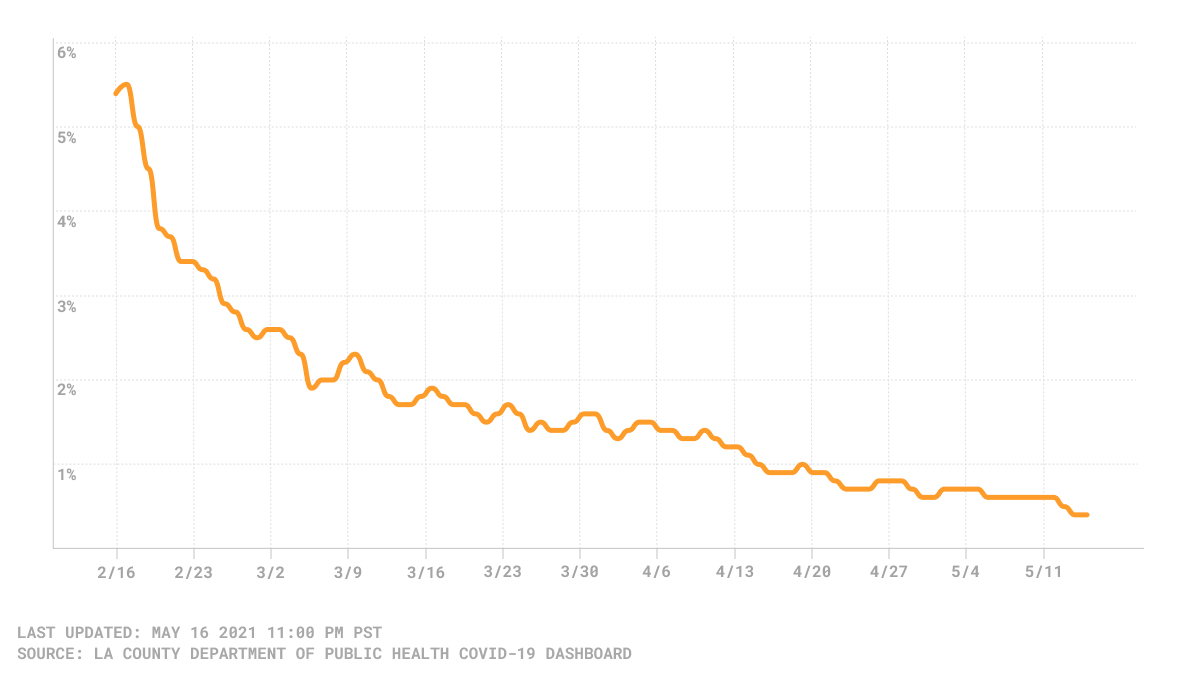
The last time the daily test-positivity rate was above 1% in Los Angeles was April 15, more than a month ago. As of Saturday, May 15, the county reported a daily test-positivity rate of 0.4%, the first time the positivity rate has been below 0.5% since the beginning of the pandemic. (The positivity rate is the percentage of COVID-19 tests that show a positive result for the virus.) At the beginning of January, this rate was above 20%.
Los Angeles County daily COVID-19 positivity rate
Hospitalizations
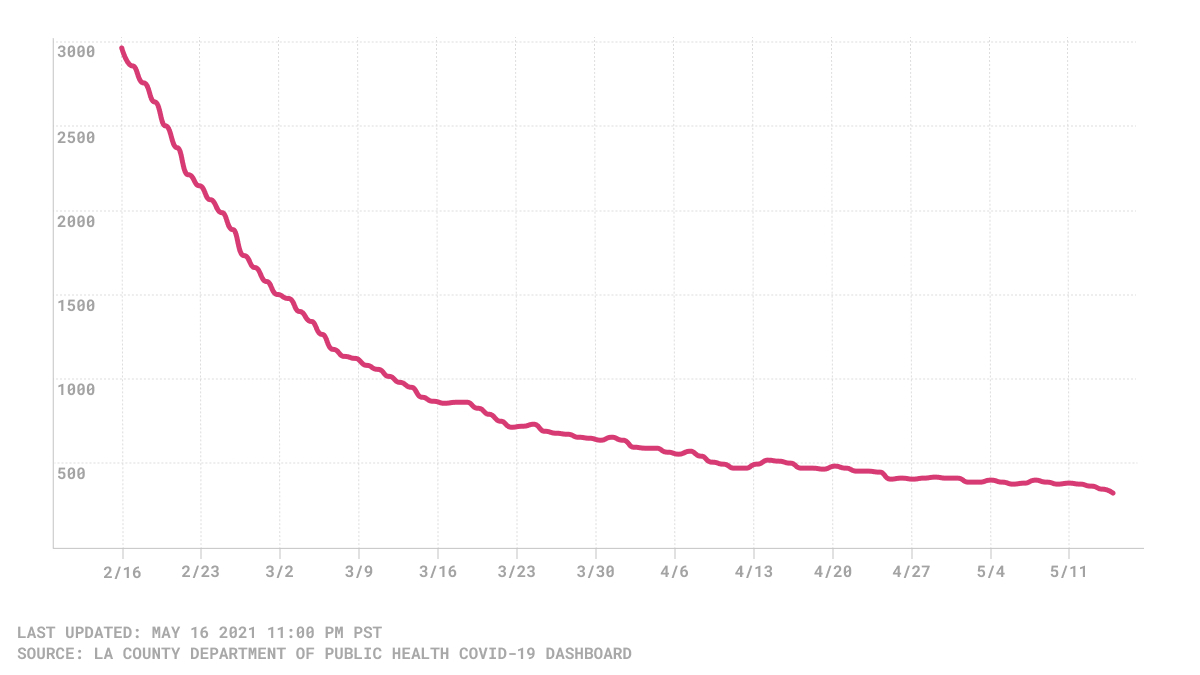
While the number of reported COVID-19 hospitalizations had previously been rising and falling around 400, this figure seems to be on a steady decline. On May 16, the county reported 325 hospitalizations, the lowest figure to date since the beginning of the pandemic. This marks a 95.7% decrease from the more than 7,500 hospitalizations reported four months ago, on Jan. 16. The last time Los Angeles County had a day with over 400 hospitalizations was May 2.
Three-day average of countywide COVID-19 hospitalizations
How We Did It: We analyzed coronavirus data related to new cases, deaths, hospitalization and vaccinations data provided by the Los Angeles County Department of Public Health.
Interested in our data? Check out the Crosstown coronavirus interactive map or email us at askus@xtown.la.


