

The Crosstown Vaccine Tracker


In recent months Crosstown has been following COVID-19 infections and other Los Angeles County data through the weekly COVID Tracker. With cases remaining low and a continuing focus on inoculations, that has been transformed to the Vaccine Tracker. Expect a weekly rundown on the latest shots in the arm, along with the most important data and other information about the local impacts of the coronavirus.
Vaccination Progress
Los Angeles County has hit an eight-figure milestone. According to the County Department of Public Health, as of June 18, a total of 10,183,455 doses of the coronavirus vaccine had been administered. That includes 4,465,652 second doses.
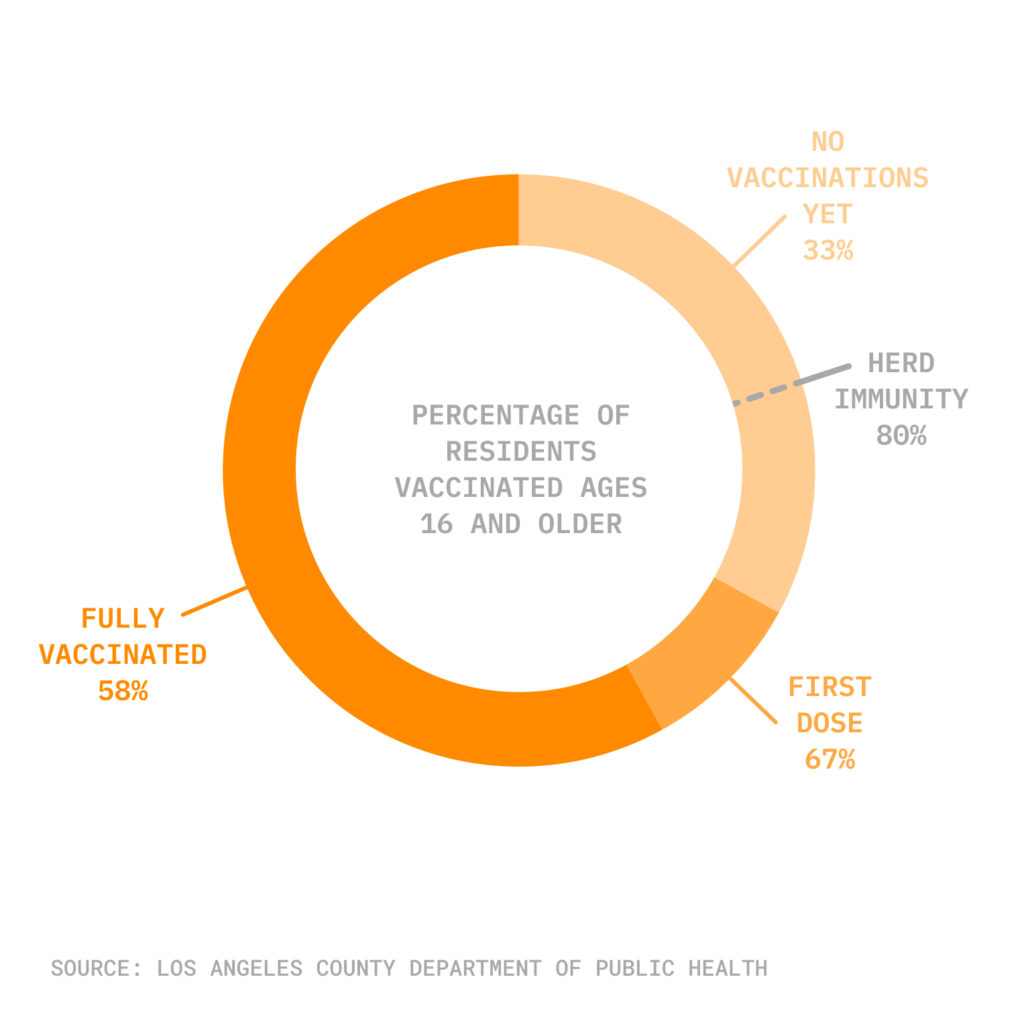 This breaks down to 67% of County residents 16 and older having received at least one dose, and 58% are considered fully vaccinated. These figures are even more impressive in those 65 and older: 86.8% of seniors have received at least one dose, and 75% are considered fully vaccinated.
Although more than half of County residents 16 and up have received full protection, the region has a ways to go before the 80% level that health officials estimate is required to achieve “herd” or “community immunity,” whereby spread essentially stops. Previously, the Department of Public Health expected to reach this level by July, but that estimate has been pushed back to October.
[Get COVID-19, crime and other stats about where you live with the Crosstown Neighborhood Newsletter]
The delay stems from the decreasing number of vaccines being administered as demand softens. From June 12-18, the County administered 258,539 vaccine doses, 150,355 of which were second shots. This is down from the 305,712 vaccines administered from June 5-11. The high point for inoculations was March 28-April 4, when 1,178,651 doses were dispensed.
Vaccinations by Location
Not all neighborhoods are being vaccinated at the same rate, and lower-income communities of color have tended to get shots at a slower pace than areas with more wealth and greater numbers of white residents.
The neighborhoods of Rancho Park, Playa Vista, Century City, Cheviot Hills and Downtown have the highest percentage of residents 16 and older who have received at least one vaccine dose (for communities in the city of Los Angeles with more than 5,000 shots administered).
City of Los Angeles neighborhoods with highest percent of residents who have received at least one vaccine doses (minimum 5,000 doses administered) 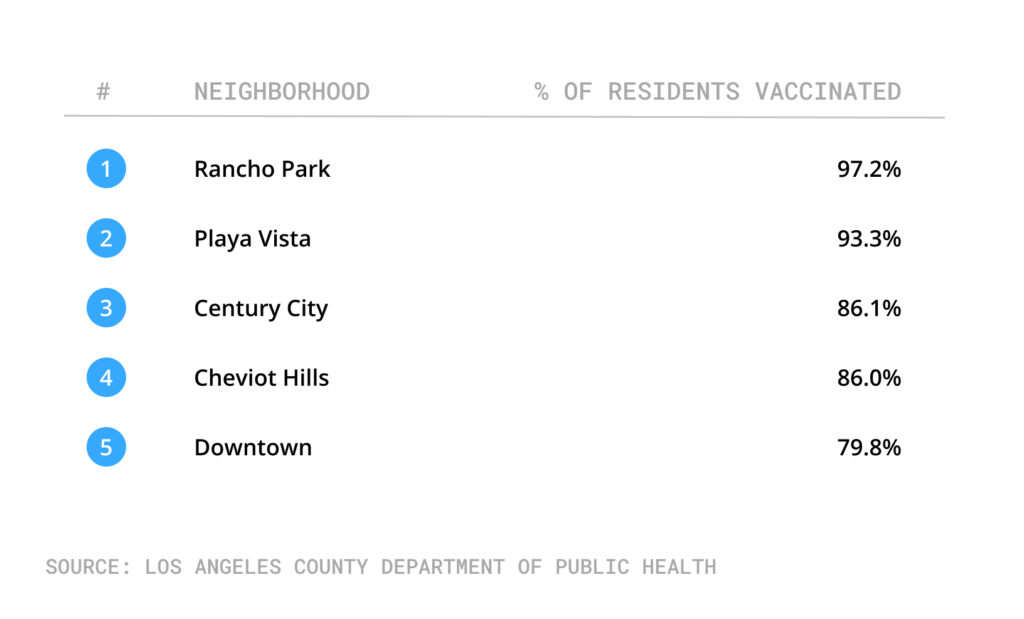
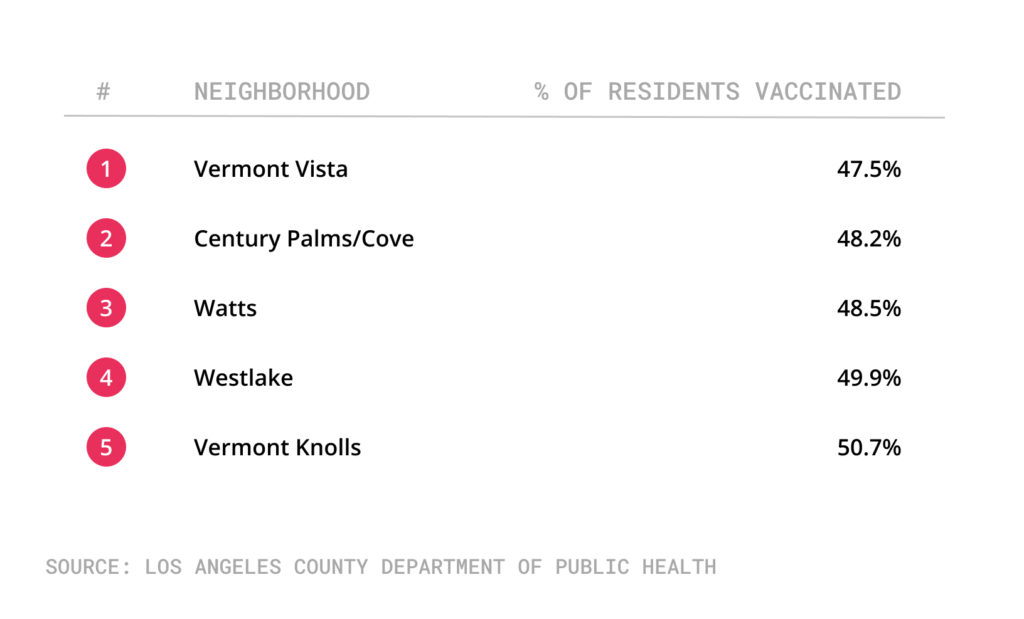
The neighborhoods of Vermont Vista, Century Palms/Cove, Watts, Westlake and Vermont Knolls are at the other end of the spectrum for this age group.
City of Los Angeles neighborhoods with lowest percent of residents who have received at least one vaccine doses (minimum 5,000 doses administered)
There is overlap in the seniors category. Affluent Rancho Park, Playa Vista, Century City, Cheviot Hills and Westwood have the highest percentage of residents 65 and older who have received at least one dose (where at least 1,000 shots have been given). The lowest percentage of protected seniors are in the communities of East Hollywood, Hollywood, Palms, Los Feliz and Historic Filipinotown.
Case by case
As more people are vaccinated, other COVID-19 figures are moving out of the spotlight. However, it is important to follow changing numbers, particularly in the wake of June 15, when the economy reopened and many restrictions were relaxed or completely lifted.
Average cases remain relatively low, but they have increased slightly in recent weeks. On June 22, the average number of COVID-19 cases over a seven-day period was 220, a 15.8% increase from the 190 average cases on June 1. However, average deaths have fallen, from nine on June 8 to six on June 22.
L.A. County hospitalizations hit their lowest point on June 14, with 212 that day; the high was 8,098 people hospitalized on Jan. 4. On Tuesday, 220 people were hospitalized with COVID-19, a decline of 97.3% from the high. Also on Tuesday, the positivity rate hit 0.8%, up from the all-time low of 0.3% reported on June 7.
How We Did It: We analyzed coronavirus data related to new cases, deaths, hospitalization and vaccinations data provided by the Los Angeles County Department of Public Health.
Interested in our data? Check out the Crosstown coronavirus interactive map or email us at askus@xtown.la.


