A changing LA seen through census data

The county has more people, is more diverse and wealthier. Its roads are more congested and its housing is more scarce. And its population has become older, like the rest of the nation. Crosstown parsed the data from the past two decennial census counts (along with other census data) to create a series of measuring sticks showing how Los Angeles County, the most populous in the nation, has evolved.
As a result of the 2020 census, California, for the first time ever, lost a congressional seat. But the state didn’t lose people. Its population grew by 2.3 million, or 6%. The nation, however, grew even more, by 7.4%.
Los Angeles County’s population now numbers 10,014,009 residents. It added 195,404 people in the past decade, or about the equivalent of the entire population of Mobile, Ala. But that is still the slowest growth ever recorded for the county over a 10-year period.
[Get COVID-19, crime and other stats about where you live with the Crosstown Neighborhood Newsletter]
In April 2010, when the previous count was taken, Los Angeles was still mired in the aftermath of the Great Recession, with a whopping 12.1% unemployment rate. The ensuing years saw a building and employment boom. But by the time the next census rolled around in April 2020, Los Angeles was reeling from another economic shock—brought on by the pandemic—and had an even higher unemployment rate of 18.2%. (There has been a steady economic recovery since then, and in July it was 10.2%.)
In spite of the broader economic landscape, home prices keep soaring, perhaps because of the slow progress of home construction. In April 2020, the median home sale price in Los Angeles County was $664,000. Last month, it was $791,000.
Looking at the changes of the past decade can offer a clue as to where Los Angeles is headed in the future, and whether its current approach to everything from transportation to housing can keep pace with the constant changes.
Los Angeles is more diverse
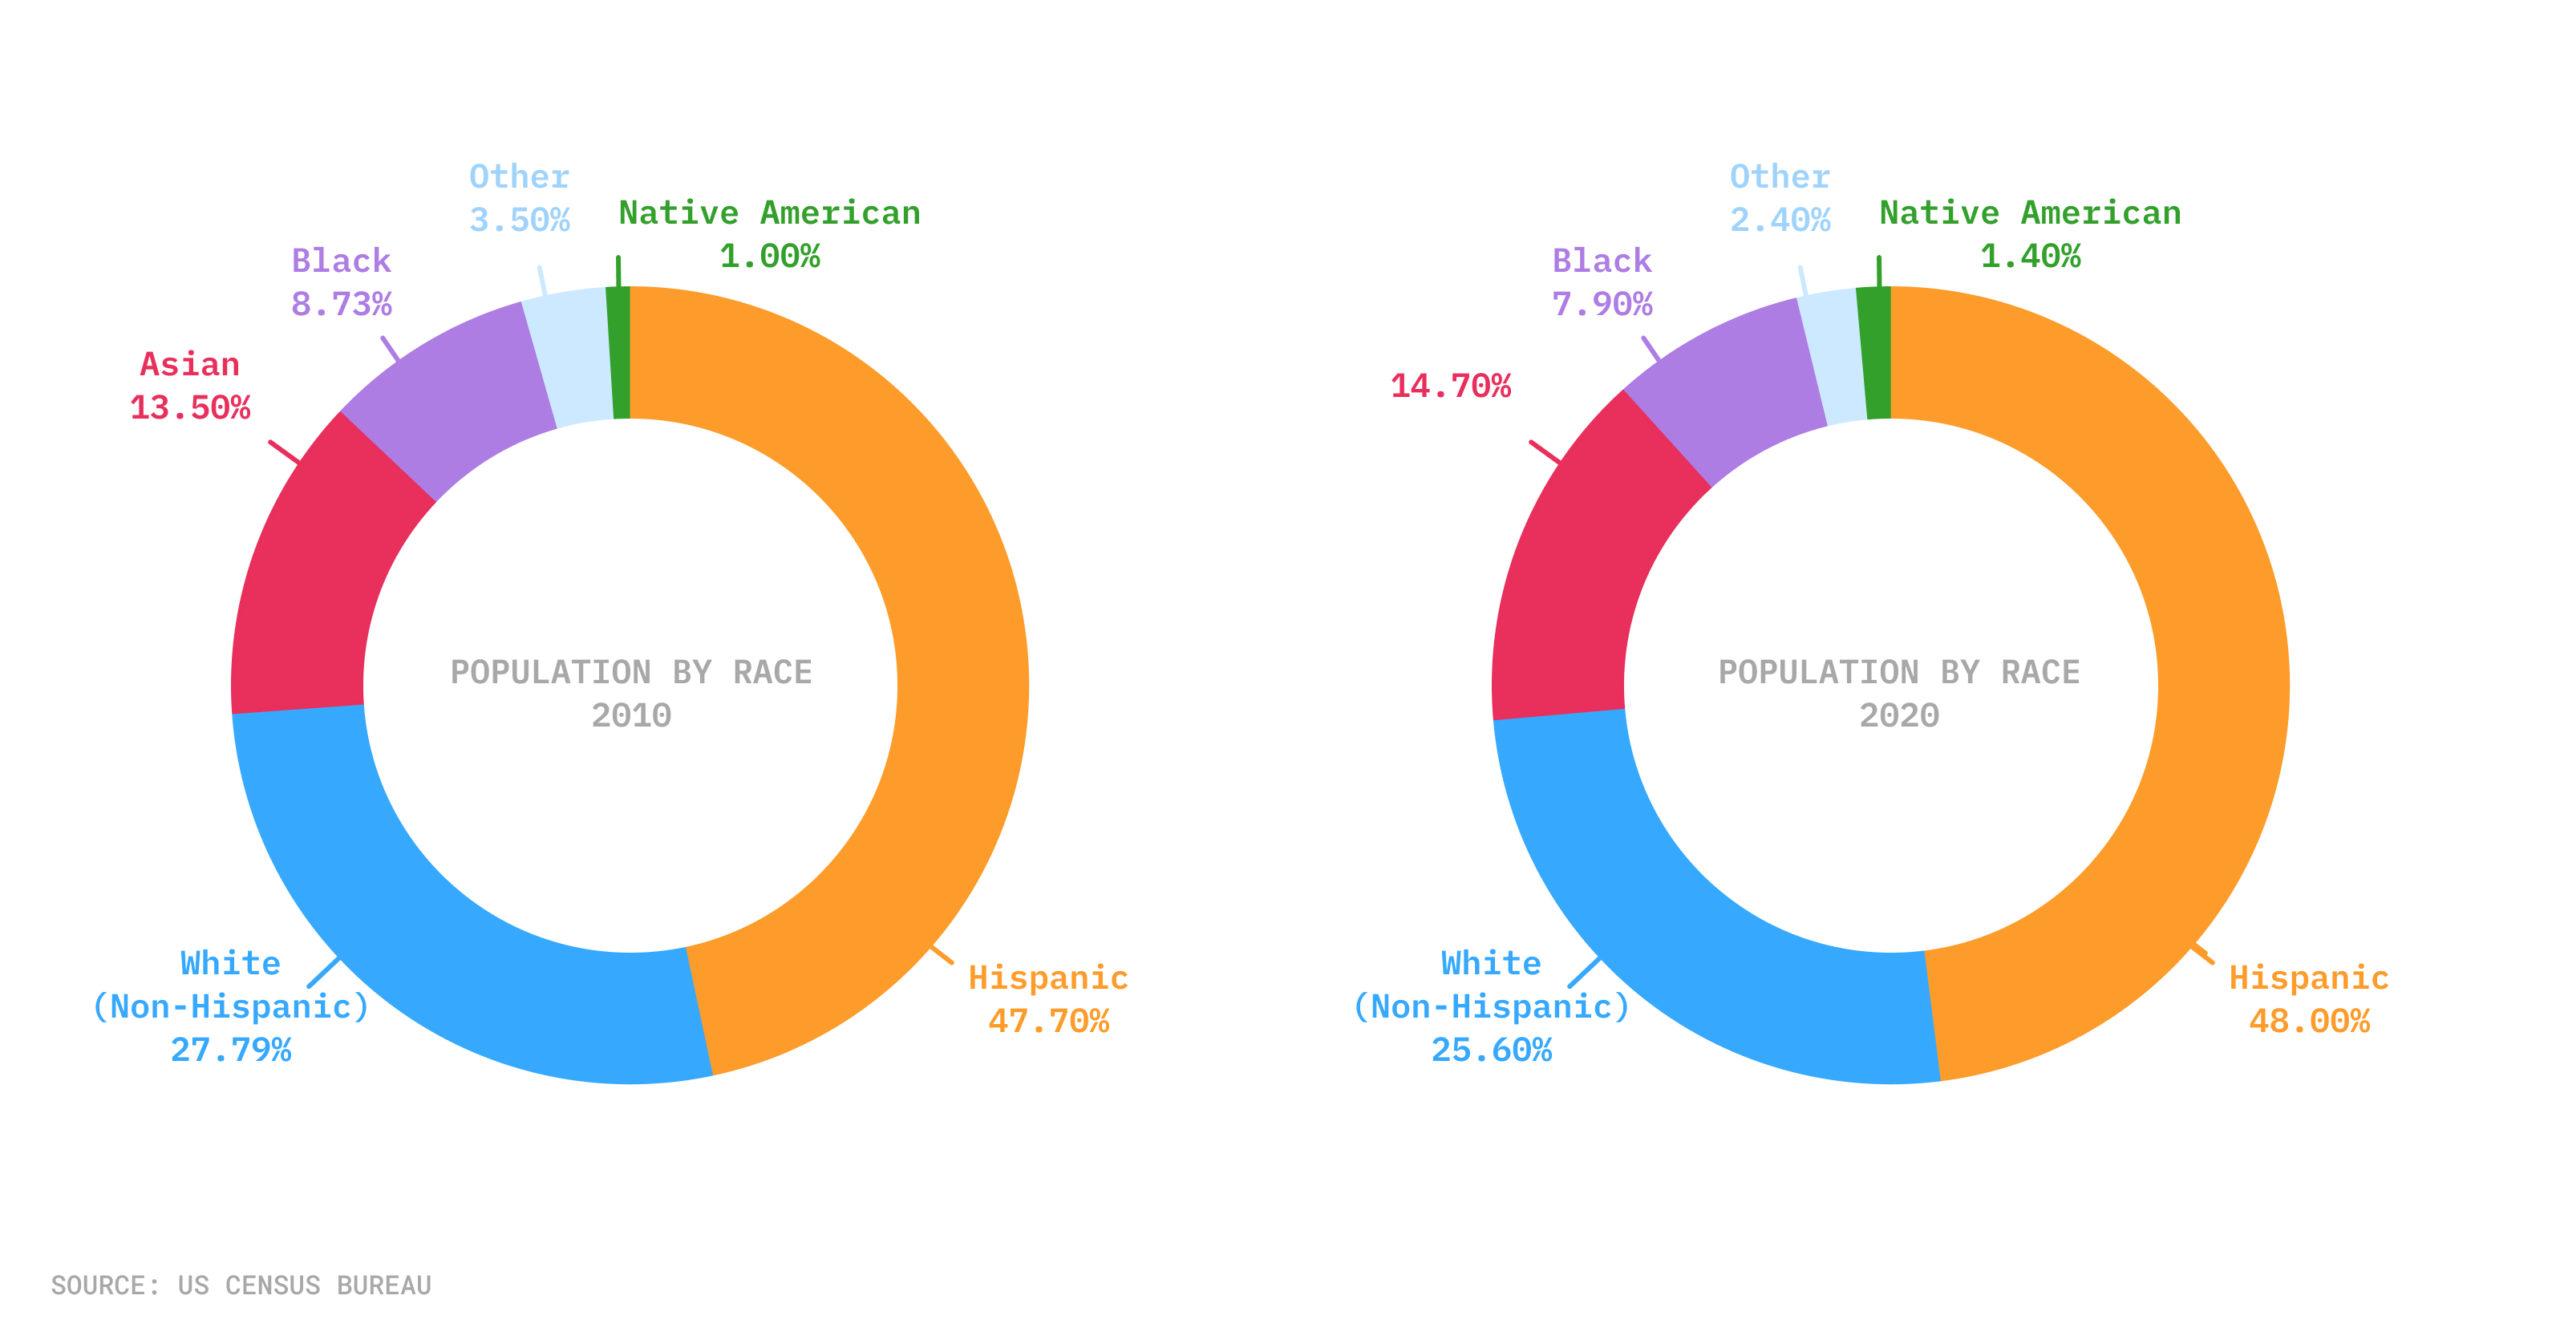
The racial and ethnic mix of Los Angeles County has shifted over the past ten years. One of the biggest changes: The Asian population has soared. Between 2010 and 2020, Los Angeles County added 153,119 Asian residents, accounting for the lion’s share of population growth in the region. At the same time, the number of Black residents in the county dropped by 62,510 and now totals around 791,000.
Los Angeles County population by race, 2010 vs. 2020
The non-Hispanic white percentage of the population fell to 25.6% from 27.8%, the biggest percentage drop of any group.
The Latino population has continued to become ever more prevalent, and although the percentage increase is slim, the county added 116,874 Latino residents in the past decade.
Los Angeles is older
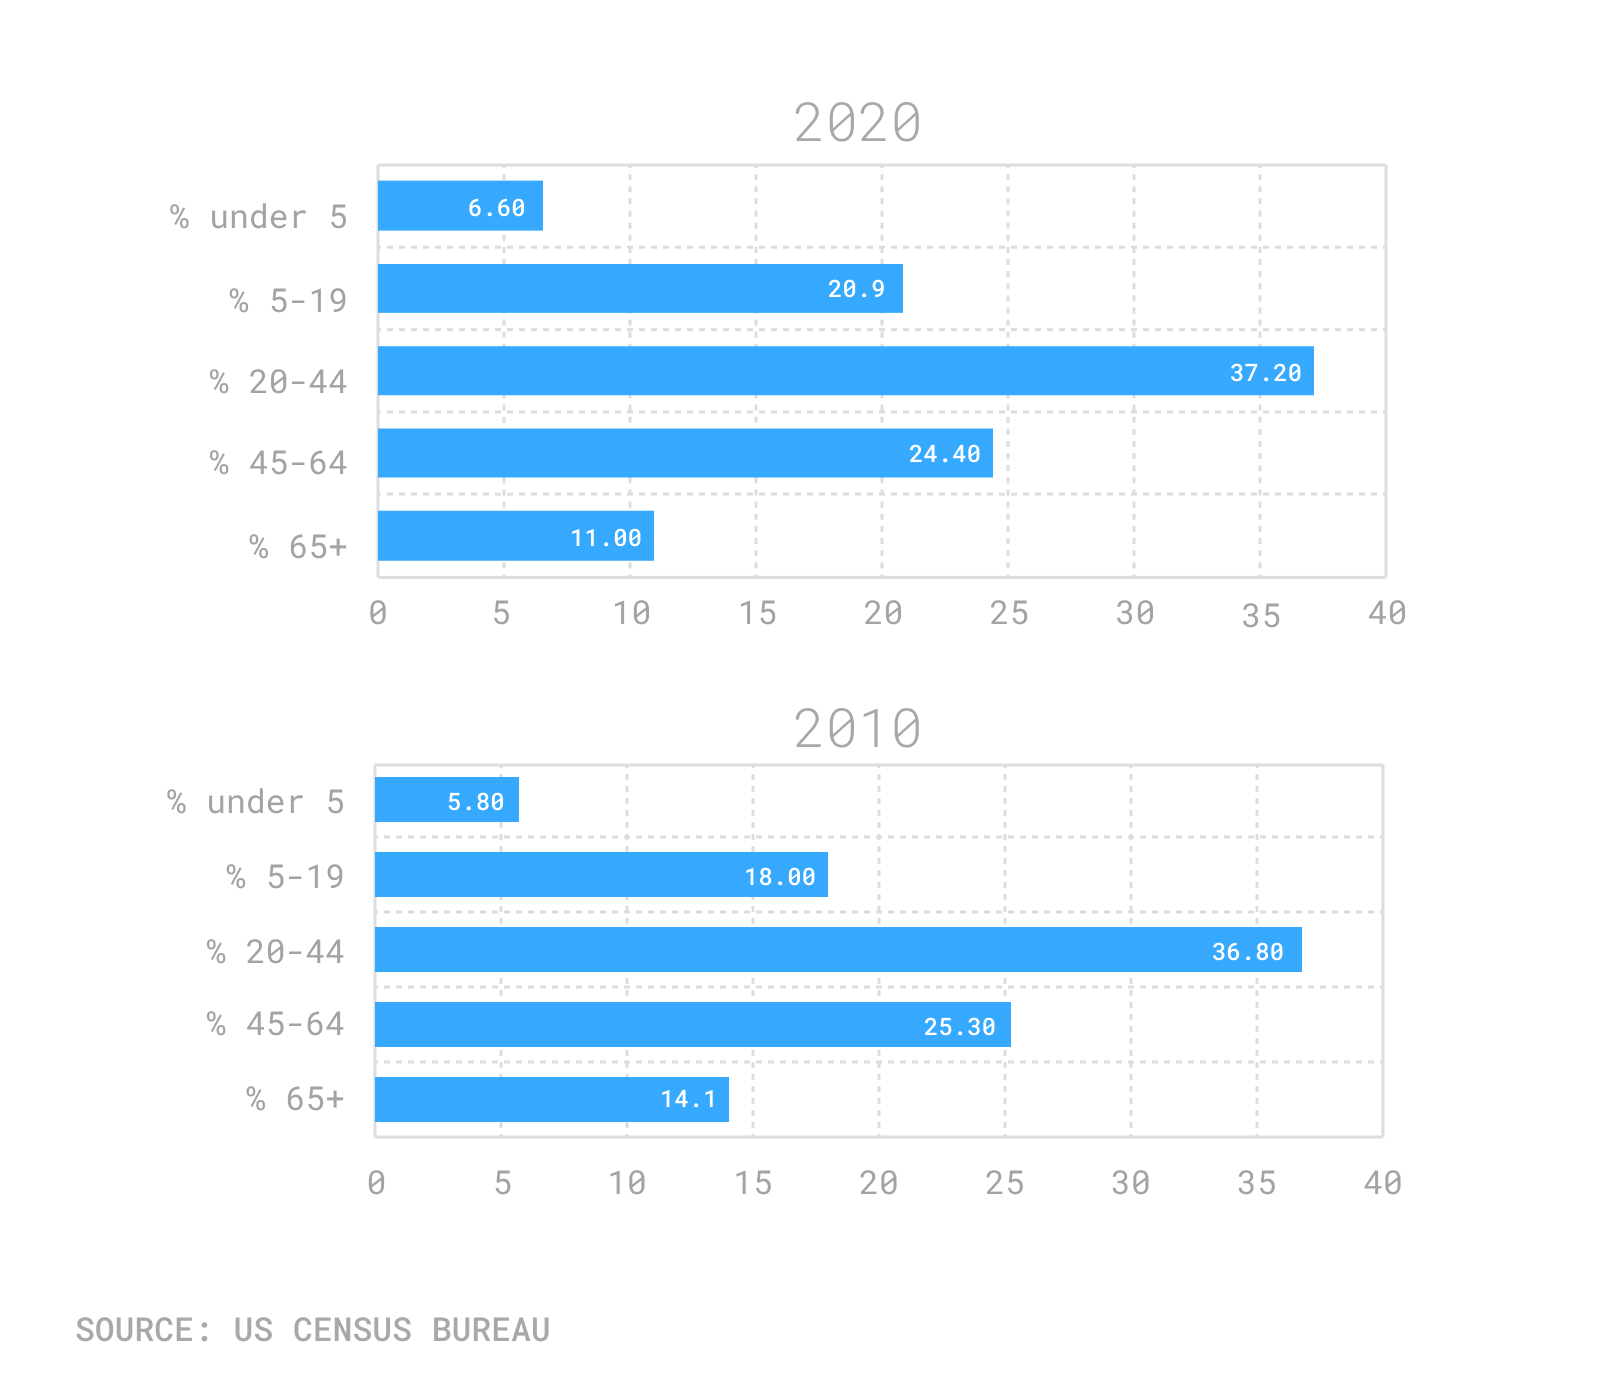
If you’re over 45 years old, there are more of you than there were a decade ago. And if you’re over 65, you are in the fastest growing age group in the county, expanding to 14.1% from 11% in 2010. Elementary and high schools won’t be adding new desks. The share of the population aged 5-19 years old fell to 18% from 20.9% in 2010.
Population breakdown by age, 2010 vs. 2020

It’s taking longer to get there
It’s not exactly a news flash to anyone who drives to work, but commute times have gotten longer. In 2019 (the most recent Census Bureau data available) the average commute time in the county rose by three minutes, to almost 33 minutes, from 2010. Think of it this way: Three extra minutes to and from work, five days a week for 48 weeks a year (hopefully you get some vacation) is an extra day of your life in traffic. No wonder many employees are clamoring to keep working from home.
Time commuters spend in traffic, 2010 vs. 2019
The horizontal numbers represent the percent of commuters, so just over 6% of commuters in 2019 spent less than 10 minutes each day in congestion.
Worst of all, the number of “super commuters” (those who spend more than an hour getting to the office) rose by 42% between 2010 and 2019.
To put that in absolute terms, more than 305,000 Los Angeles County residents joined the ranks of super commuters in the past decade.
Longer commute times are linked to another sore spot of modern-day Los Angeles: high housing costs, which force people to seek shelter further into the suburbs and farther away from work.
Despite plenty of investment in new bus and subway lines, a smaller percentage of Angelenos are using public transportation. In 2019, 5.7% of commuters took mass transit, down from 7.2% in 2010. And since the onset of the coronavirus era, ridership on Metro’s trains and buses has tumbled.
A little bit better off
Even when adjusted for inflation, Angelenos across the board made wage gains. (It’s possible those gains were dented by rising housing costs.)
Changes in income broken down by race, 2010 vs. 2019
Some groups’ wealth rose faster than others. The median income of Asian residents between 2010 and 2019 (the most recent census data available) increased by 20%. Median Hispanic incomes grew 19%, according to the data, and incomes of non-Hispanic white residents increased by 14.2%. The gain for Black residents was more modest, at 6%.
Also, as of 2019, before the pandemic hit, 9.9% of Los Angeles County residents did not have health insurance.
*Correction: In a earlier version of this story, the chart depicting the breakdown of age contained four bars that were of incorrect length. The chart has been adjusted. In addition, in an earlier version, the key on the graph depicting commute times was mislabeled.
How we did it: We compared categories from the 2010 decennial count with the 2020 decennial count for overall population, age and racial and ethnic composition of Los Angeles County. For other categories, such as income and commute times, we compared the Census Bureau’s American Community Survey data from 2010 and 2019. Some of the main sources can be found here, here and here. Have other questions or want to know more about our data?
Write to us at askus@xtown.la.


